
Compose Multiplatform · Kotlin · Open source
HDCharts, at home on every screen.
Build clear, customizable data visualizations for Android, iOS, desktop, and web with one Compose-first library.
Line, bar, pie, radar, and histogram charts, with flexible styling and interaction.
Quick start
A chart in a few lines.
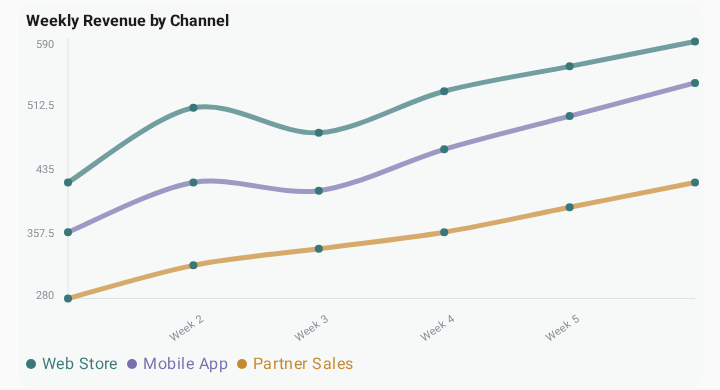
Pass a list of numbers and get a line chart. Add styling and interaction when you need them.
Read the setup guide@Composable
private fun ShowLine() {
val data = listOf(
"Web Store" to listOf(42.0, 38.0, 45.0, 51.0),
"Mobile App" to listOf(31.0, 35.0, 40.0, 44.0),
"Partner Sales" to listOf(24.0, 29.0, 33.0, 39.0),
).toChartData(
categories = listOf("Q1", "Q2", "Q3", "Q4"),
)
LineChart(data = data, title = "Revenue by Channel")
}Keep exploring