
Scatter and Bubble Chart
Overview
Scatter charts place each point at its numeric X and Y coordinates to show how two measures relate. Add a size to each point to encode a third measure as a bubble whose area scales with that value. Each series uses a palette color; overlapping bubbles use transparency.
Add the scatter chart module to your dependencies:
implementation("io.github.hdcharts:scatter:3.0.1-SNAPSHOT")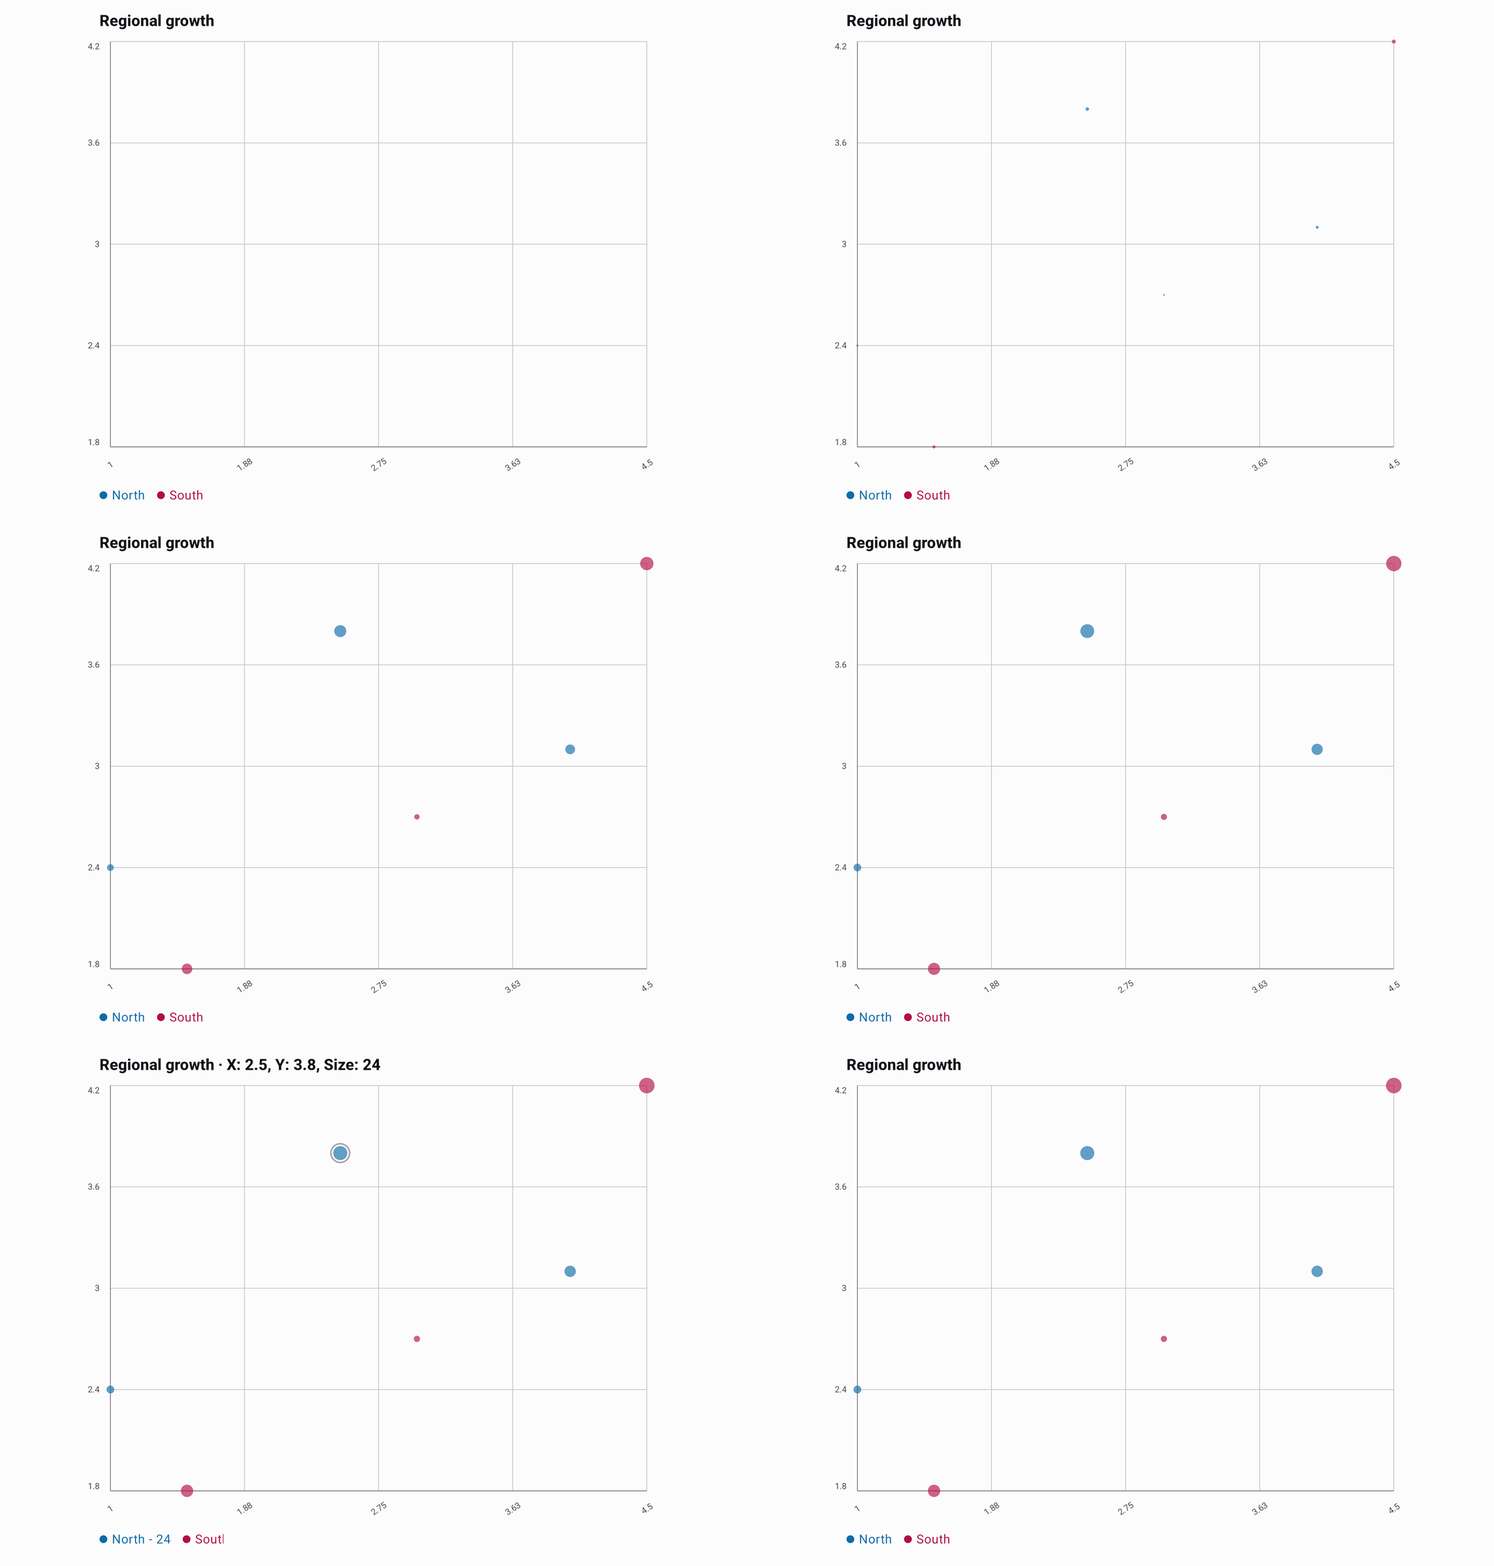
The GIF selects points in both series, then taps empty plot space to clear selection. It uses the same data as Basic Usage.
Recording source: ScatterDefaultGifScenario, using ScatterBasicExample.kt.
Basic Usage
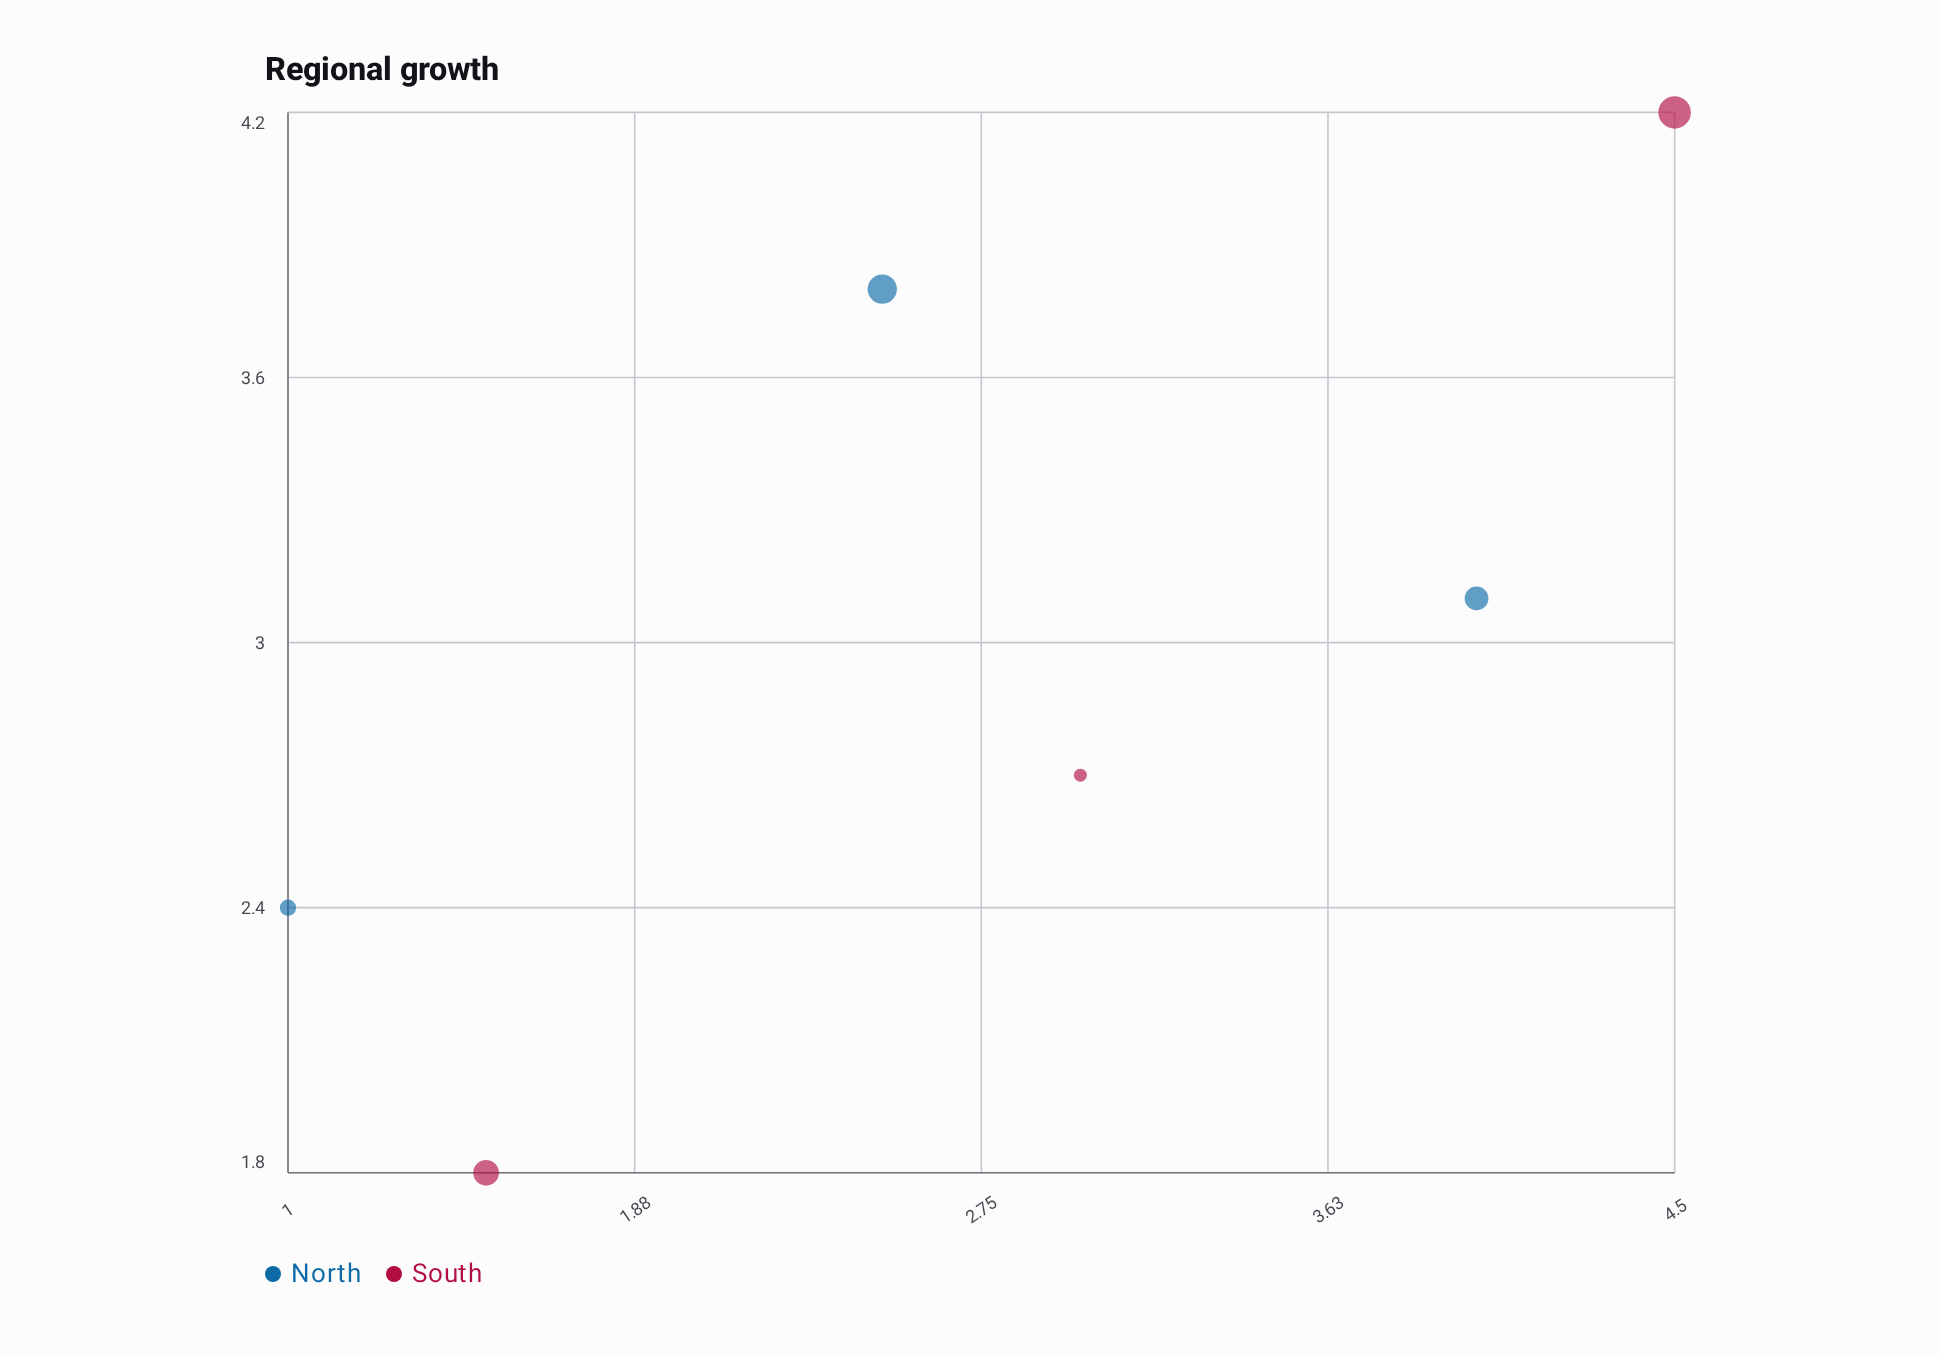
import androidx.compose.runtime.Composable
import androidx.compose.ui.Modifier
import io.github.hdcharts.scatter.ScatterChart
import io.github.hdcharts.scatter.ScatterData
import io.github.hdcharts.scatter.ScatterPoint
import io.github.hdcharts.scatter.ScatterSeries

@Composable
fun ScatterBasicExample(modifier: Modifier = Modifier) {
    val north =
        ScatterSeries(
            name = "North",
            points =
                listOf(
                    ScatterPoint(x = 1.0, y = 2.4, size = 12.0),
                    ScatterPoint(x = 2.5, y = 3.8, size = 24.0),
                    ScatterPoint(x = 4.0, y = 3.1, size = 18.0),
                ),
        )
    val south =
        ScatterSeries(
            name = "South",
            points =
                listOf(
                    ScatterPoint(x = 1.5, y = 1.8, size = 20.0),
                    ScatterPoint(x = 3.0, y = 2.7, size = 10.0),
                    ScatterPoint(x = 4.5, y = 4.2, size = 28.0),
                ),
        )
    val data = ScatterData(series = listOf(north, south))
    ScatterChart(data = data, modifier = modifier, title = "Regional growth")
}
Data Mapping
Use ScatterPoint(x, y) for a scatter marker. Supply size when the third measure should control bubble area; points without a size use the configured fixed marker size.
The smallest and largest size values across all series map to circles with radii
ScatterPointStyle.minSize and maxSize. Bubble areas interpolate linearly between those limits.
When all size values are equal, bubbles use the midpoint area.
Capabilities
Fixed Numeric Ranges
Set either axis bound independently. Unset bounds use the data extent.
Fully automatic axes expand constant values by 5% on each side, with at least one unit of padding. The expanded bounds stay finite.
val style = ScatterChartDefaults.style(
    range = ScatterRangeStyle(xMin = 0.0, xMax = 5.0, yMin = 0.0),
)
Selection
Tapping or dragging near a point selects it. Tapping empty plot space clears selection. The chart heading shows the selected point's X, Y, and optional size values.
Pass a ChartSelection to control selection from the application. Its zero-based index counts
points in series order, then in point order within each series. In Basic Usage, initialIndex = 3
selects the first South point, after the three North points. Set interactionEnabled = false to
disable gestures while keeping programmatic selection visible.