
Line Chart
LineChart renders single or multi-series line data. It has one composable with two
render modes, selected via renderMode.
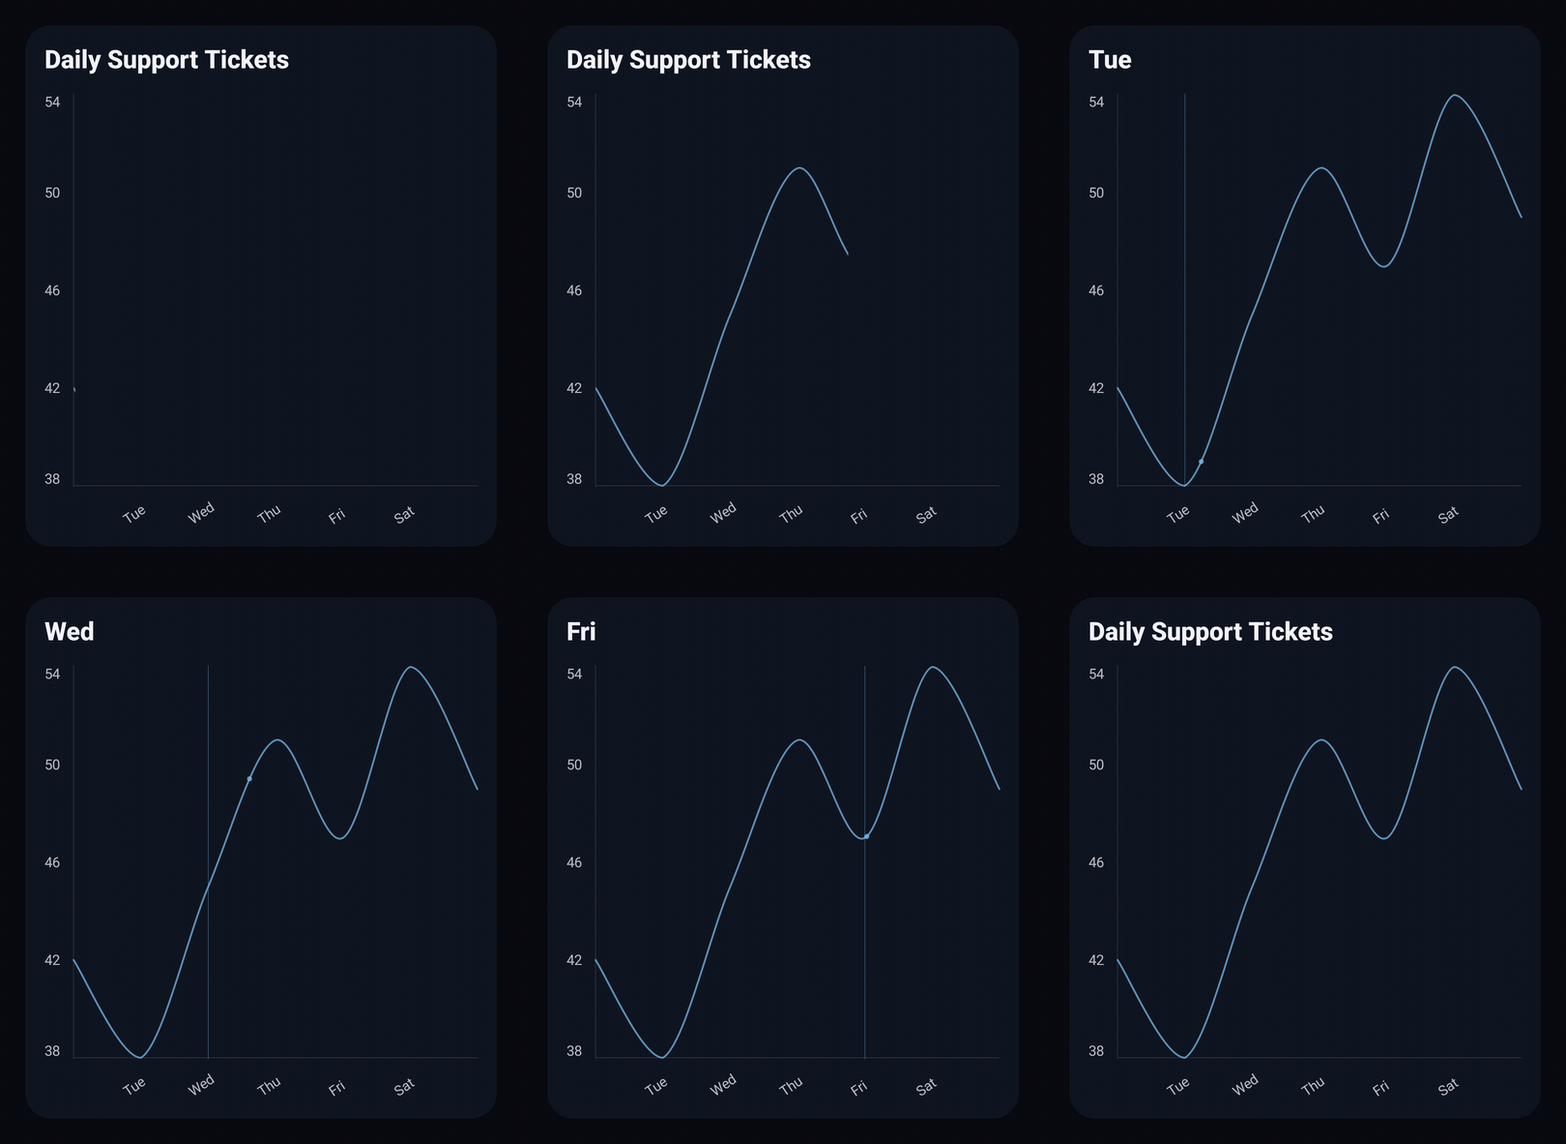
Basic Usage
@Composable
private fun ShowLine() {
    val values = listOf(42.0, 38.0, 45.0, 51.0, 47.0, 54.0, 49.0)
    val labels = listOf("Mon", "Tue", "Wed", "Thu", "Fri", "Sat", "Sun")

    LineChart(
        data = values.toChartData(categories = labels),
        title = "Daily Support Tickets",
    )
}
Multi-Series
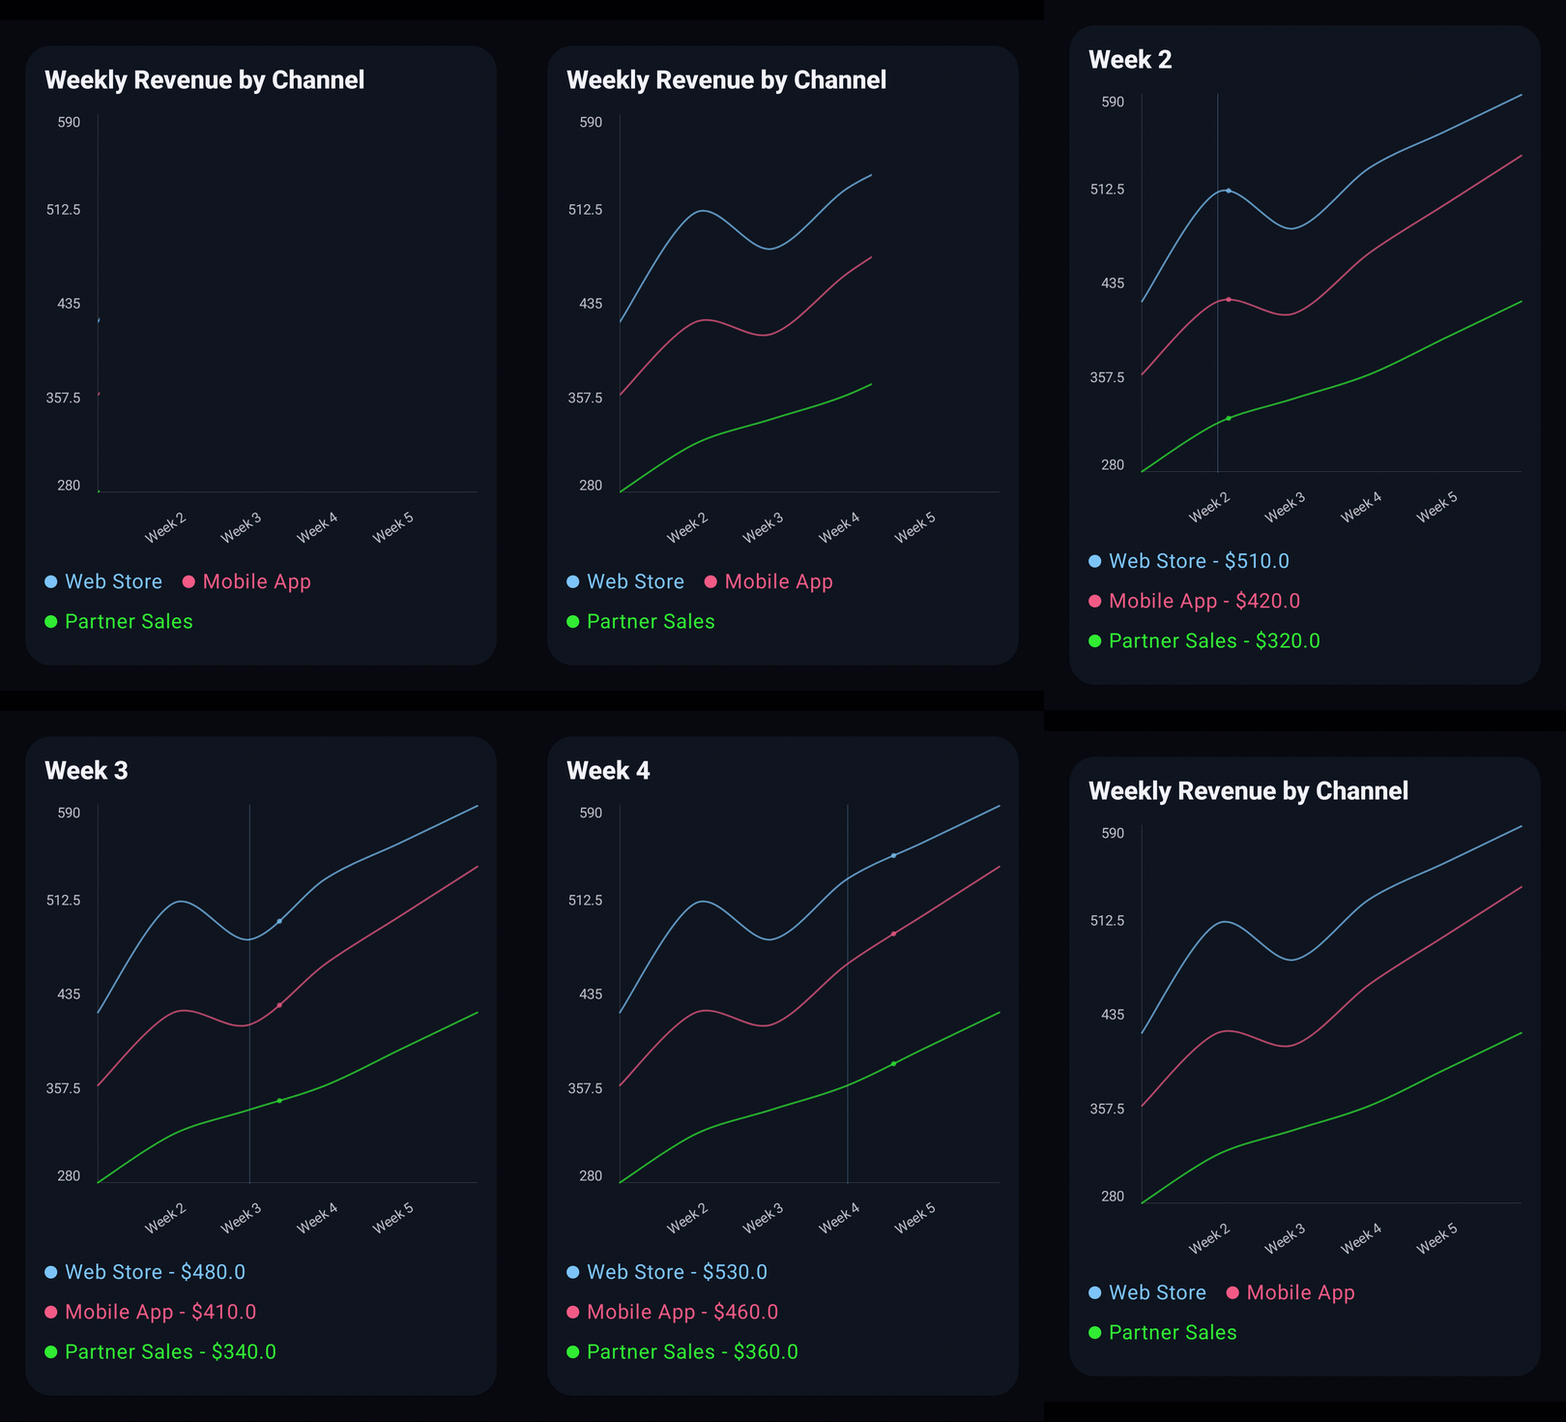
Pass more than one named series to plot multiple lines on the same chart.
@Composable
private fun ShowMultiLine() {
    val categories = listOf("Week 1", "Week 2", "Week 3", "Week 4", "Week 5", "Week 6")

    val items = listOf(
        "Web Store" to listOf(420.0, 510.0, 480.0, 530.0, 560.0, 590.0),
        "Mobile App" to listOf(360.0, 420.0, 410.0, 460.0, 500.0, 540.0),
        "Partner Sales" to listOf(280.0, 320.0, 340.0, 360.0, 390.0, 420.0),
    )

    val data = items.toChartData(categories = categories)

    LineChart(
        data = data,
        title = "Weekly Revenue by Channel",
        valueFormatter = ChartValueFormatters.prefix("$"),
    )
}
Fixed Y-Axis Range
By default the Y-axis is derived from the data, which can make small fluctuations look
exaggerated when the axis doesn't start at zero. Set range on LineChartDefaults.style()
to pin min, max, or both, independently of one another; whichever bound you leave null
keeps deriving from the data.
@Composable
private fun ShowLineWithRange() {
    val values = listOf(42.0, 38.0, 45.0, 51.0, 47.0, 54.0, 49.0)
    val labels = listOf("Mon", "Tue", "Wed", "Thu", "Fri", "Sat", "Sun")

    LineChart(
        data = values.toChartData(categories = labels),
        title = "Daily Support Tickets",
        style = LineChartDefaults.style(
            range = LineChartDefaults.range(min = 0.0, max = 100.0),
        ),
    )
}
Render Modes
LineChart has one composable with two render modes, selected via renderMode.
Morph
The default mode. When data changes, the line animates smoothly from its old shape to
the new one. This is the right choice for most charts, including ones with large point
counts that support zoom and scroll.
@Composable
private fun ShowMorphingLine() {
    var values by remember { mutableStateOf(listOf(42.0, 38.0, 45.0, 51.0, 47.0, 54.0, 49.0)) }
    val labels = listOf("Mon", "Tue", "Wed", "Thu", "Fri", "Sat", "Sun")

    Column {
        LineChart(
            data = values.toChartData(categories = labels),
            title = "Daily Support Tickets",
            renderMode = LineChartRenderMode.Morph,
        )
        Button(onClick = { values = values.map { it + Random.nextDouble(-8.0, 8.0) } }) {
            Text("Update")
        }
    }
}
Timeline
Built for live, continuously updating data. Instead of morphing, new points slide the whole
chart horizontally like a rolling window, and the Y-axis rescales automatically as old
values leave the window. Interaction (selection, gestures) is disabled in this mode.
animationDuration sets the update speed — how long each new point takes to slide into
place — and should match how often data actually changes.
@Composable
private fun ShowLiveLine(liveTicks: Flow<Double>) {
    val labels = remember { mutableStateListOf<String>() }
    val values = remember { mutableStateListOf<Double>() }

    LaunchedEffect(liveTicks) {
        liveTicks.collect { tick ->
            values.add(tick)
            labels.add(values.size.toString())
        }
    }

    LineChart(
        data = values.toChartData(categories = labels),
        title = "Live Sensor Reading",
        renderMode = LineChartRenderMode.Timeline,
        animationDuration = 500.milliseconds,
    )
}