
Radar Chart
Overview
RadarChart compares one or more series across shared categories drawn as radial axes. Use it for
profiles such as readiness scores when the same measures apply to every series. Each series needs at
least three values, and all series must have the same number of values. Category labels, when
provided, name those axes in order. Values at each list position map to the category at that same
position.
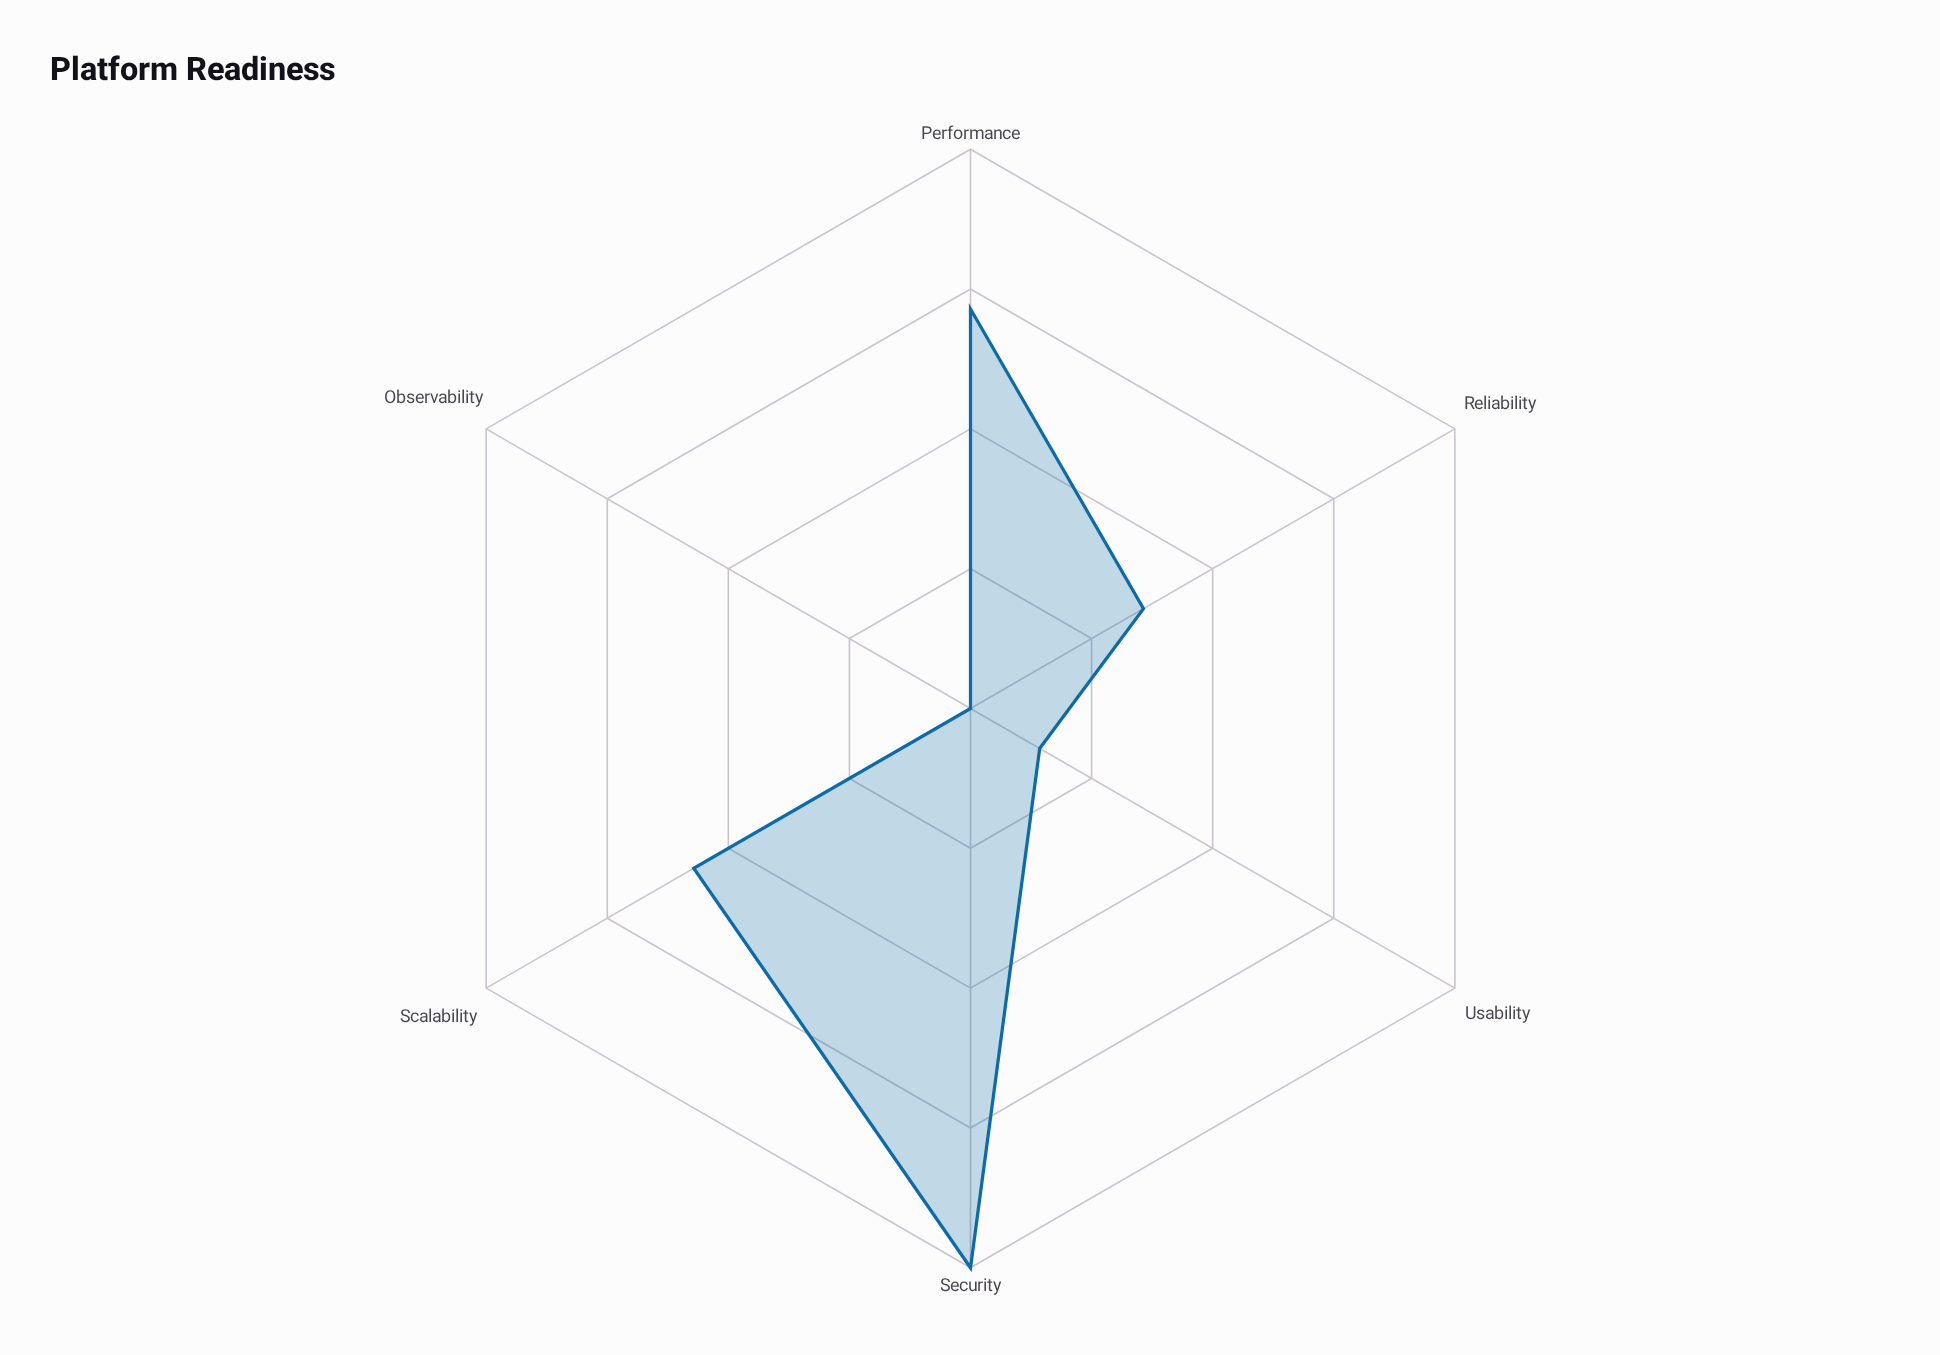
By default, the chart scales all series together from the data minimum to the maximum. The minimum appears at the center and the maximum at the outer web, so the center does not mean zero. In the example below, 74 is at the center and the polygon emphasizes profile shape rather than absolute scores. Set a shared range when values have known bounds or need to remain comparable as data changes.
implementation("io.github.hdcharts:radar:3.1.0-SNAPSHOT")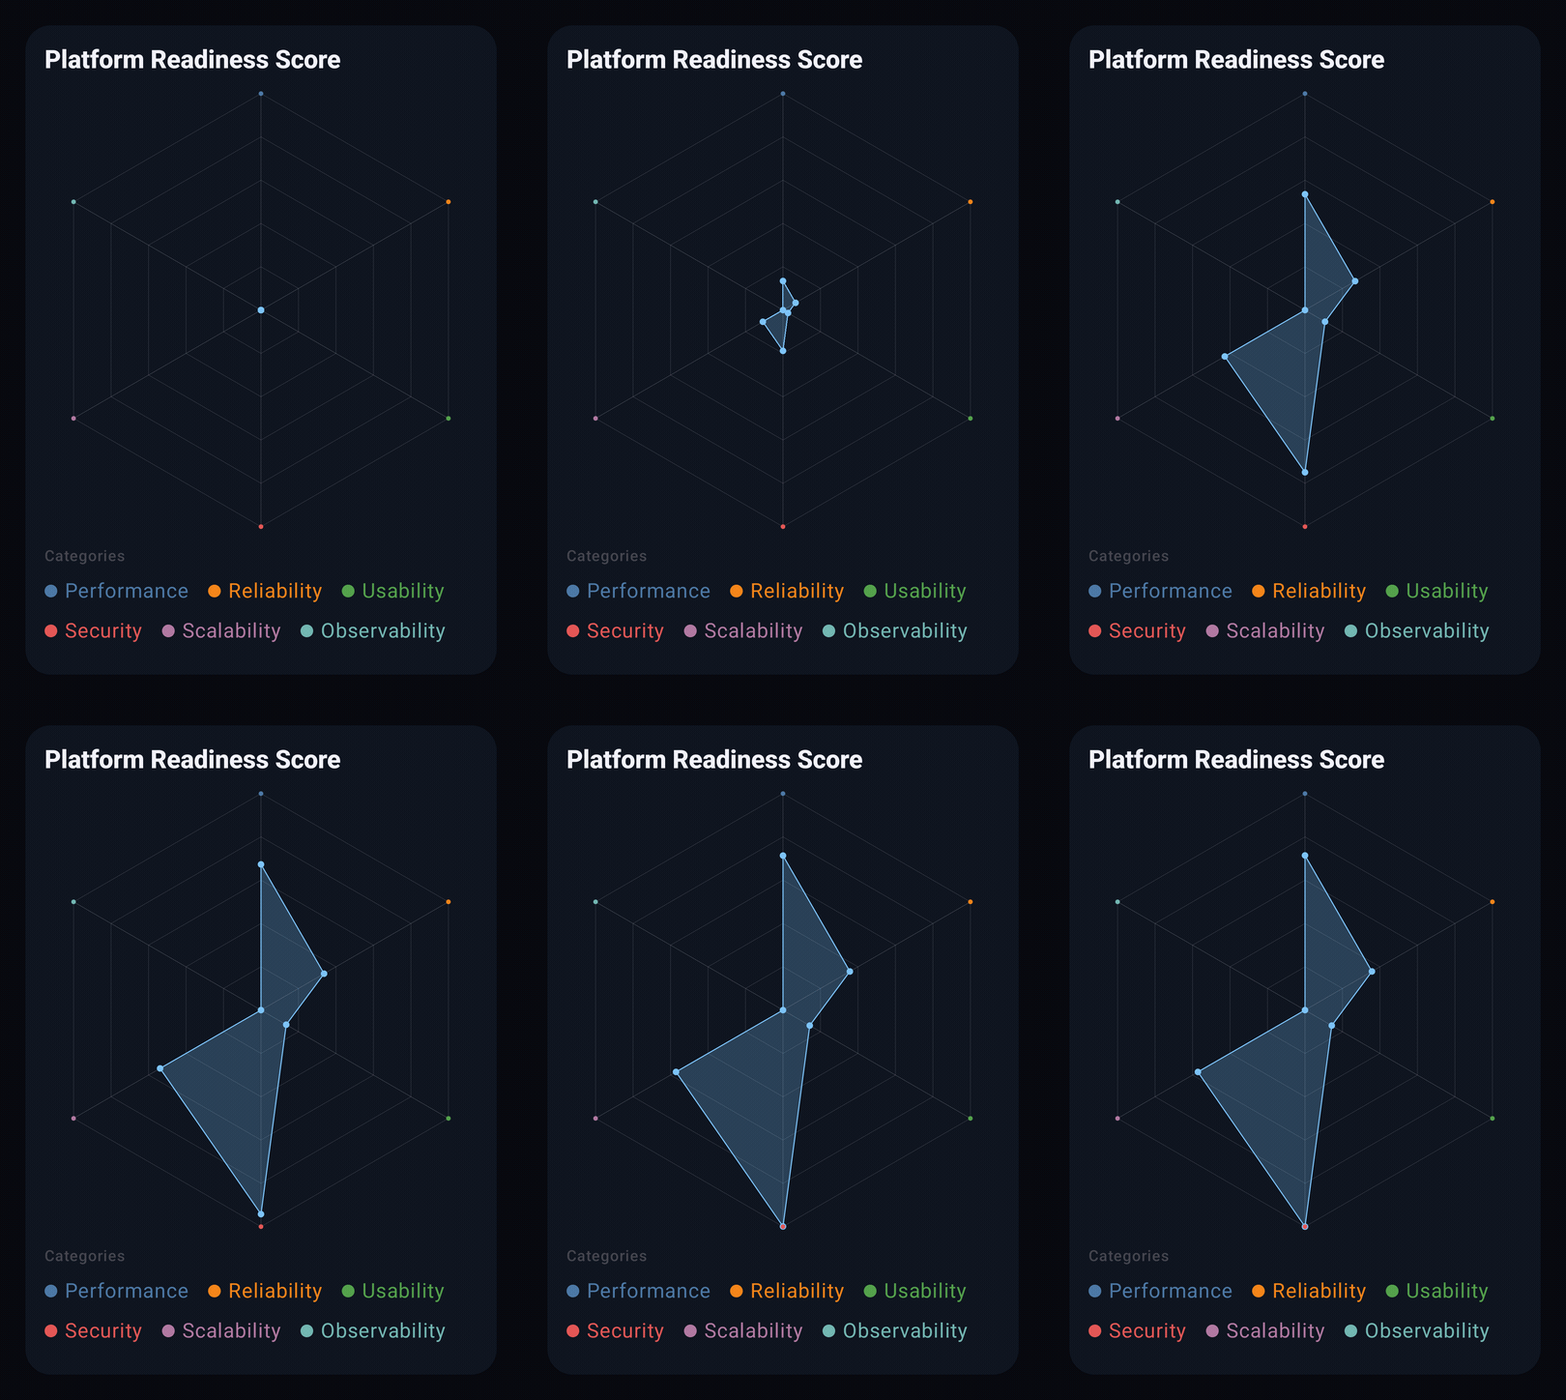
The GIF demonstrates multi-series selection.
Recording source: RadarExample.kt.
Basic Usage
Each readiness metric maps to one radar axis. Values are placed on those axes in list order, and the category names label the same positions.
import androidx.compose.runtime.Composable
import androidx.compose.ui.Modifier
import io.github.hdcharts.core.model.toChartData
import io.github.hdcharts.radar.RadarChart

internal data class ReadinessMetric(
    val category: String,
    val score: Double,
) {
    companion object {
        const val TITLE = "Platform Readiness"
        const val SERIES_NAME = "Current release"

        val sample =
            listOf(
                ReadinessMetric("Performance", 84.0),
                ReadinessMetric("Reliability", 79.0),
                ReadinessMetric("Usability", 76.0),
                ReadinessMetric("Security", 88.0),
                ReadinessMetric("Scalability", 82.0),
                ReadinessMetric("Observability", 74.0),
            )
    }
}

@Composable
fun ShowPlatformReadiness(modifier: Modifier = Modifier) {
    val data =
        ReadinessMetric.sample.toChartData(
            value = ReadinessMetric::score,
            category = ReadinessMetric::category,
            seriesName = ReadinessMetric.SERIES_NAME,
        )

    RadarChart(
        data = data,
        modifier = modifier,
        title = ReadinessMetric.TITLE,
    )
}
Capabilities
Fixed Value Range
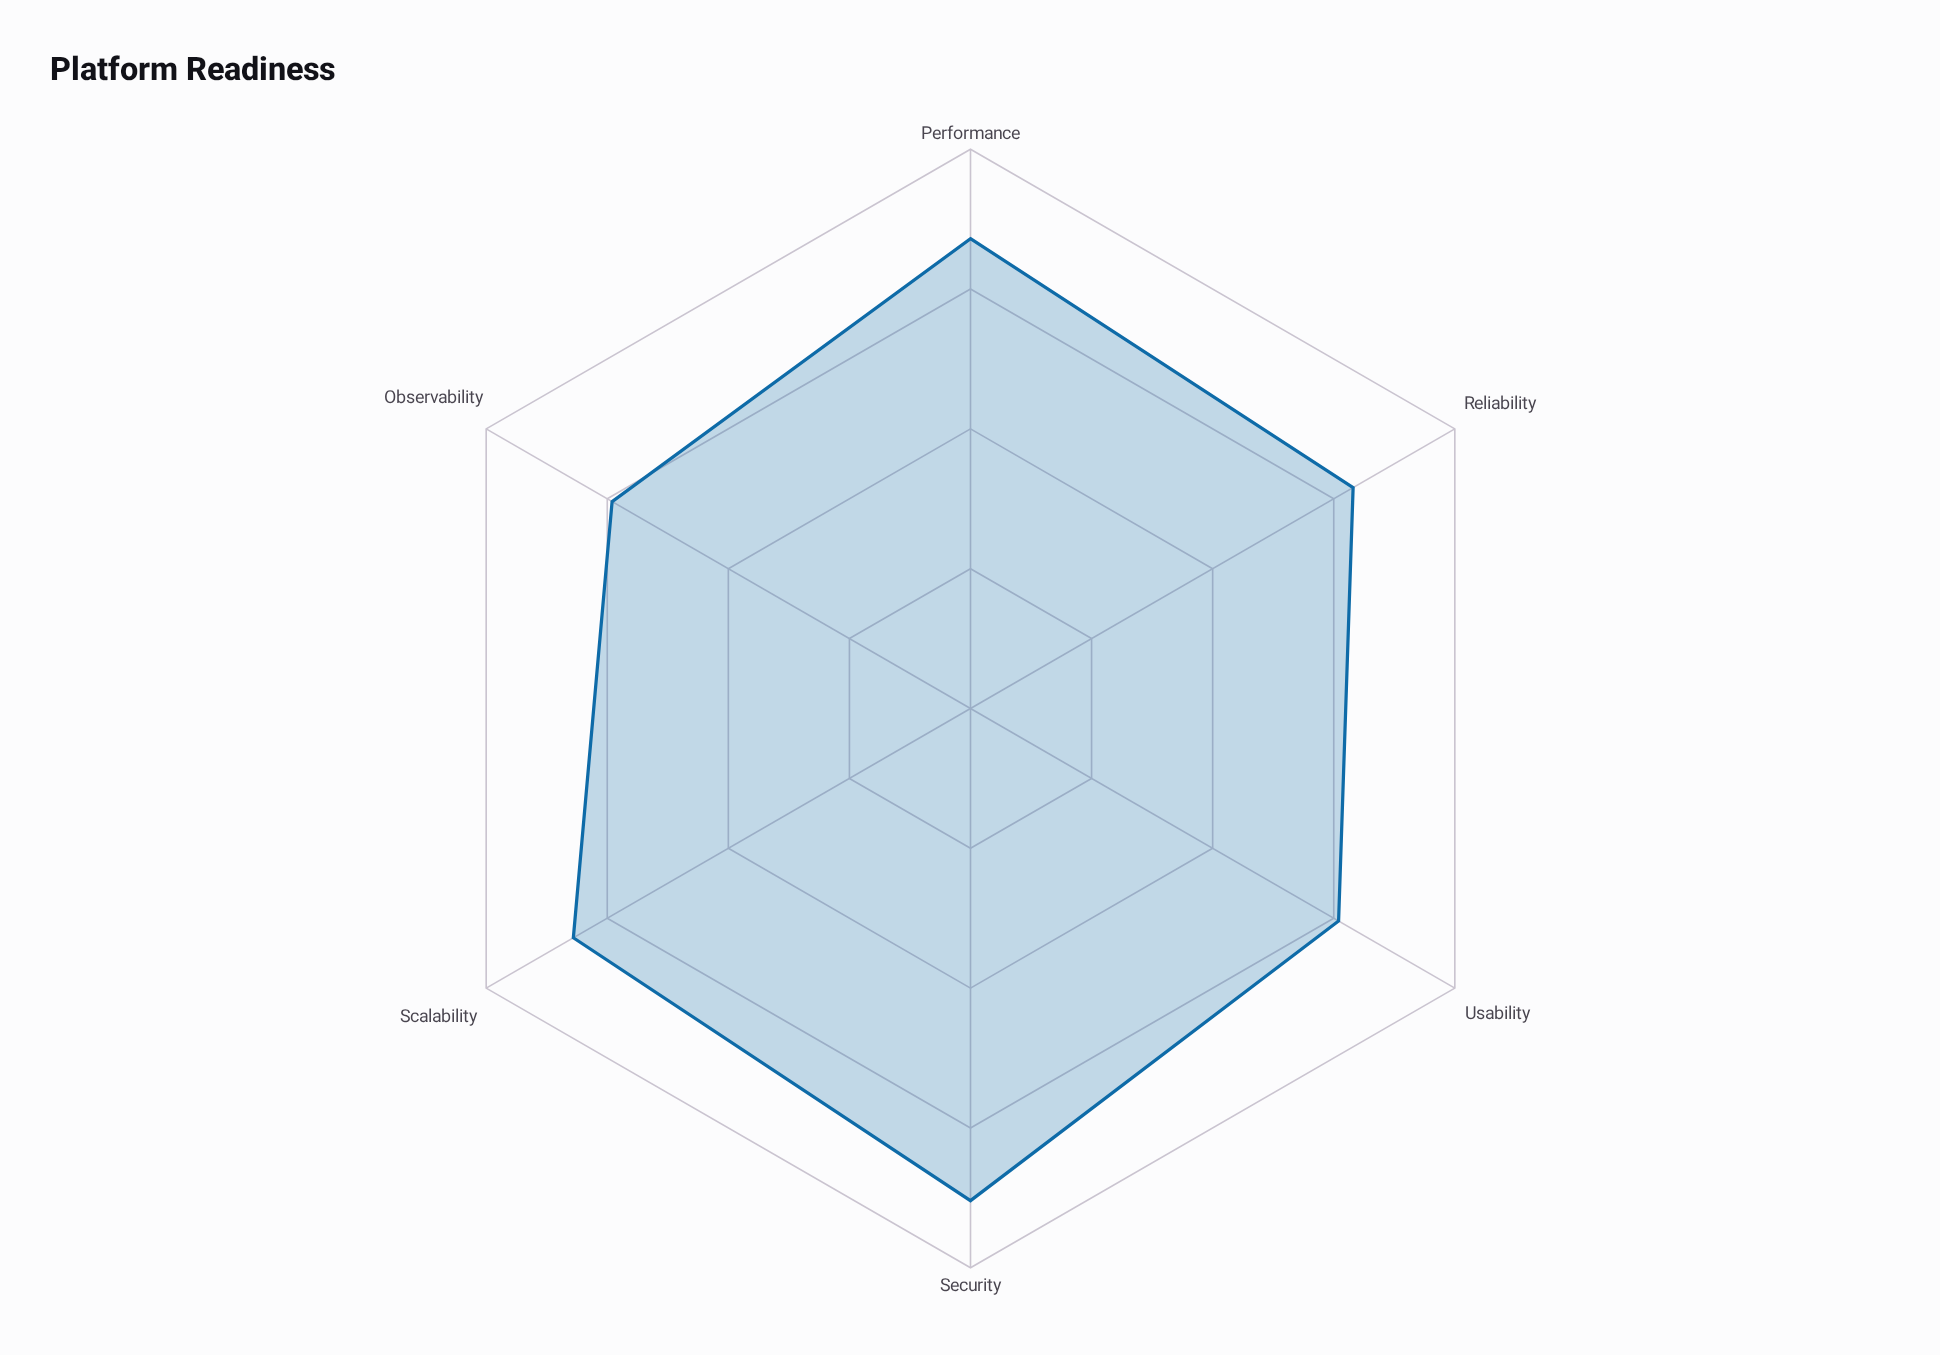
Automatic scaling maps the dataset minimum to the center and maximum to the outer edge. A fixed
0..100 range maps zero to the center and 100 to the outer edge. Both visuals use the same data;
only the range configuration changes. This excerpt reuses data from Basic Usage.
@Composable
fun ShowReadinessOnFixedScale(
    data: ChartData,
    modifier: Modifier = Modifier,
) {
    RadarChart(
        data = data,
        modifier = modifier,
        title = "Platform Readiness",
        style =
            RadarChartDefaults.style(
                range = RadarChartDefaults.range(min = 0.0, max = 100.0),
            ),
    )
}| Automatic scaling | Fixed range (0–100) |
|---|---|
|  |
Tap either screenshot to view it at full size.
Multiple Series
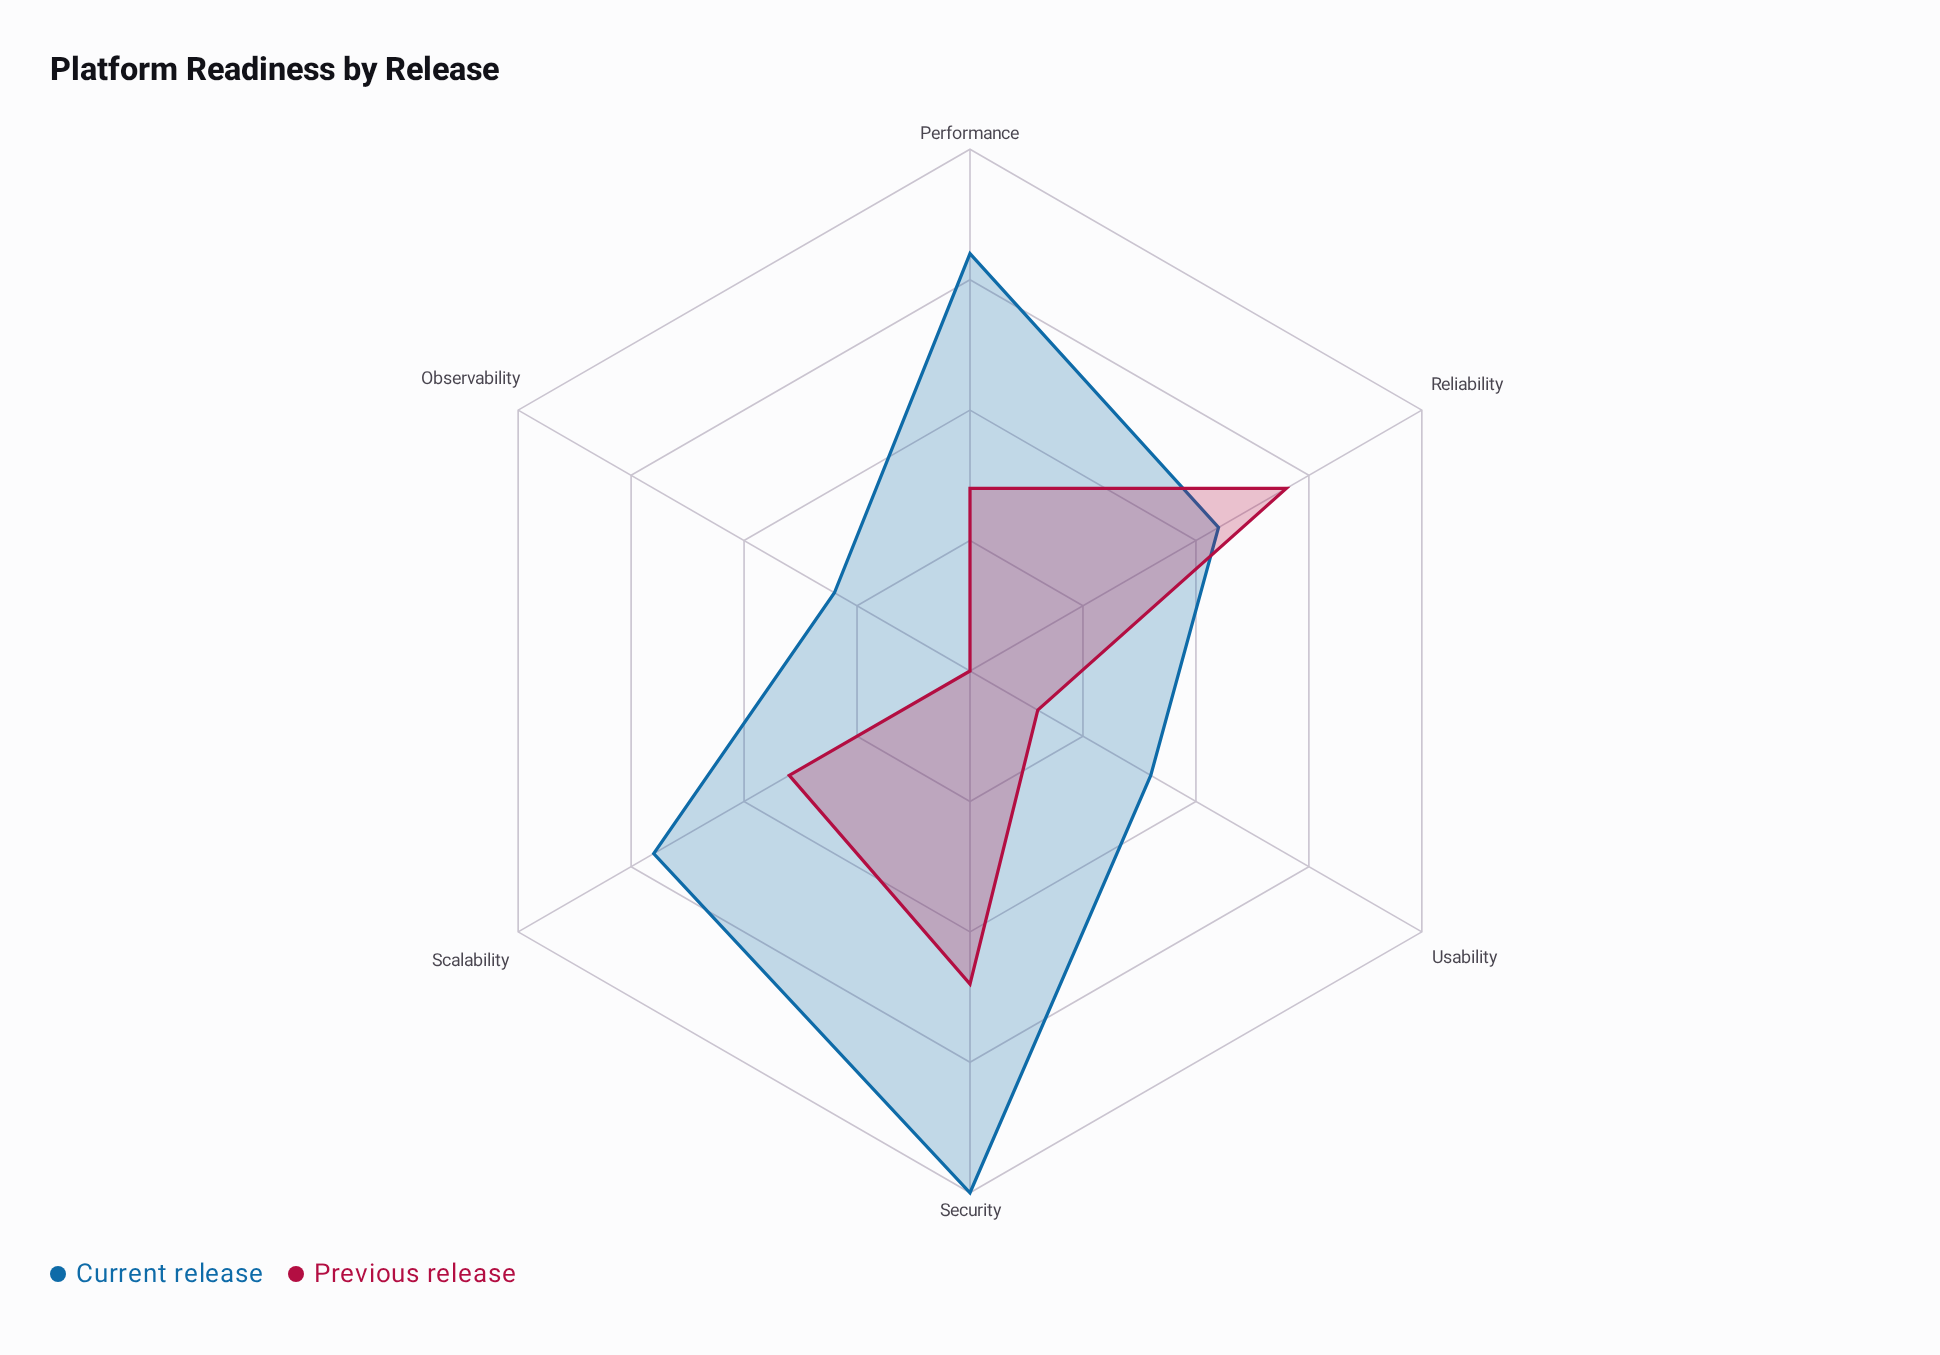
Each series supplies a value for every shared category, in the same order. The polygons therefore compare releases on matching axes. This example uses the same readiness categories as Basic Usage and adds the previous release.
@Composable
fun ComparePlatformReleases(modifier: Modifier = Modifier) {
    val categories = listOf("Performance", "Reliability", "Usability", "Security", "Scalability", "Observability")
    val data =
        listOf(
            "Current release" to listOf(84.0, 79.0, 76.0, 88.0, 82.0, 74.0),
            "Previous release" to listOf(75.0, 82.0, 71.0, 80.0, 76.0, 68.0),
        ).toChartData(categories = categories)

    RadarChart(data = data, modifier = modifier, title = "Platform Readiness by Release")
}
Category Selection
Dragging across the plot selects a category axis. The selected value at that category is highlighted
for each series; the other category points and labels are dimmed. With one series, the title shows
Category: value; with several series, the title names the category and the legend shows each
formatted value. A tap clears the category selection. Hoist selection when the application needs
to read or set the selected category index. This excerpt reuses data from Basic Usage.
@Composable
fun SelectReadinessCategory(data: ChartData) {
    val categorySelection = rememberChartSelection()

    RadarChart(
        data = data,
        selection = categorySelection,
    )
}
Series Selection
seriesSelection focuses a whole series by tapping its outline; other series fade, and tapping an
overlap again cycles through the series there. This is separate from selection, which identifies
one shared category across the series. Use both state holders when the screen needs to observe both
dimensions. This excerpt reuses the multi-series data from the previous example.
@Composable
fun FocusReadinessSeries(data: ChartData) {
    val seriesSelection = rememberChartSelection()

    RadarChart(
        data = data,
        seriesSelection = seriesSelection,
    )
}
Styling and Layout
Set a palette with one color per series. fillAlpha controls the translucent polygon fill;
grid.steps controls the number of grid intervals; and axes.labelPadding adjusts space between
the web and category labels. The default layout reserves space for labels. This excerpt reuses the
multi-series data from the previous example.
@Composable
fun StyledReadinessRadar(data: ChartData) {
    RadarChart(
        data = data,
        style =
            RadarChartDefaults.style(
                grid = RadarChartDefaults.grid(steps = 4),
                axes = RadarChartDefaults.axes(labelPadding = 10.dp),
                polygon =
                    RadarChartDefaults.polygon(
                        lineColors = listOf(Color(0xFF2563EB), Color(0xFFDB2777)),
                        fillVisible = true,
                        fillAlpha = 0.16f,
                    ),
            ),
    )
}