
Stacked Area Chart
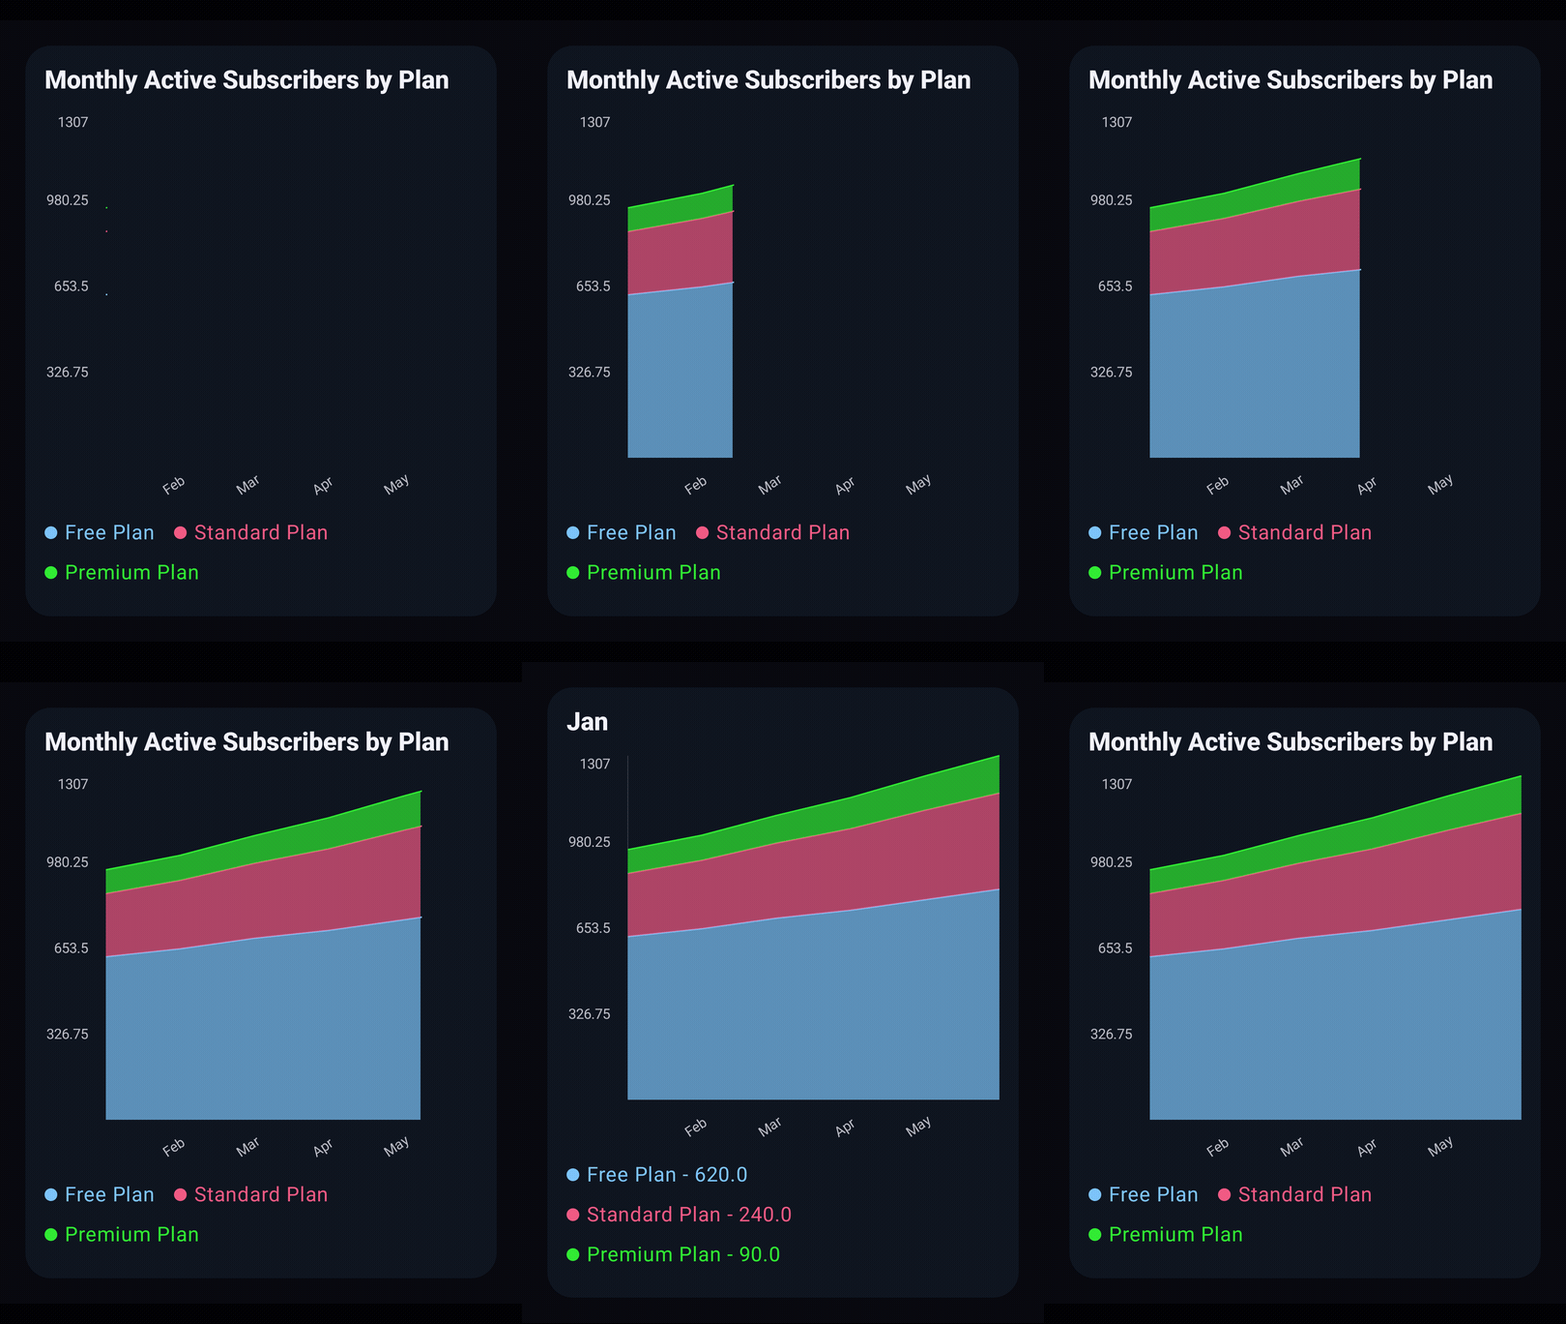
StackedAreaChart renders multiple series as cumulative, stacked areas over a shared category axis.
@Composable
private fun ShowStackedArea() {
    val items = listOf(
        "Free Plan" to listOf(620.0, 650.0, 690.0, 720.0, 760.0, 800.0),
        "Standard Plan" to listOf(240.0, 260.0, 285.0, 310.0, 340.0, 365.0),
        "Premium Plan" to listOf(90.0, 95.0, 105.0, 118.0, 130.0, 142.0),
    )

    val data = items.toChartData(categories = listOf("Jan", "Feb", "Mar", "Apr", "May", "Jun"))

    StackedAreaChart(data = data, title = "Monthly Active Subscribers by Plan")
}