
Bar Chart
BarChart renders categorical values as vertical bars, positive or negative.
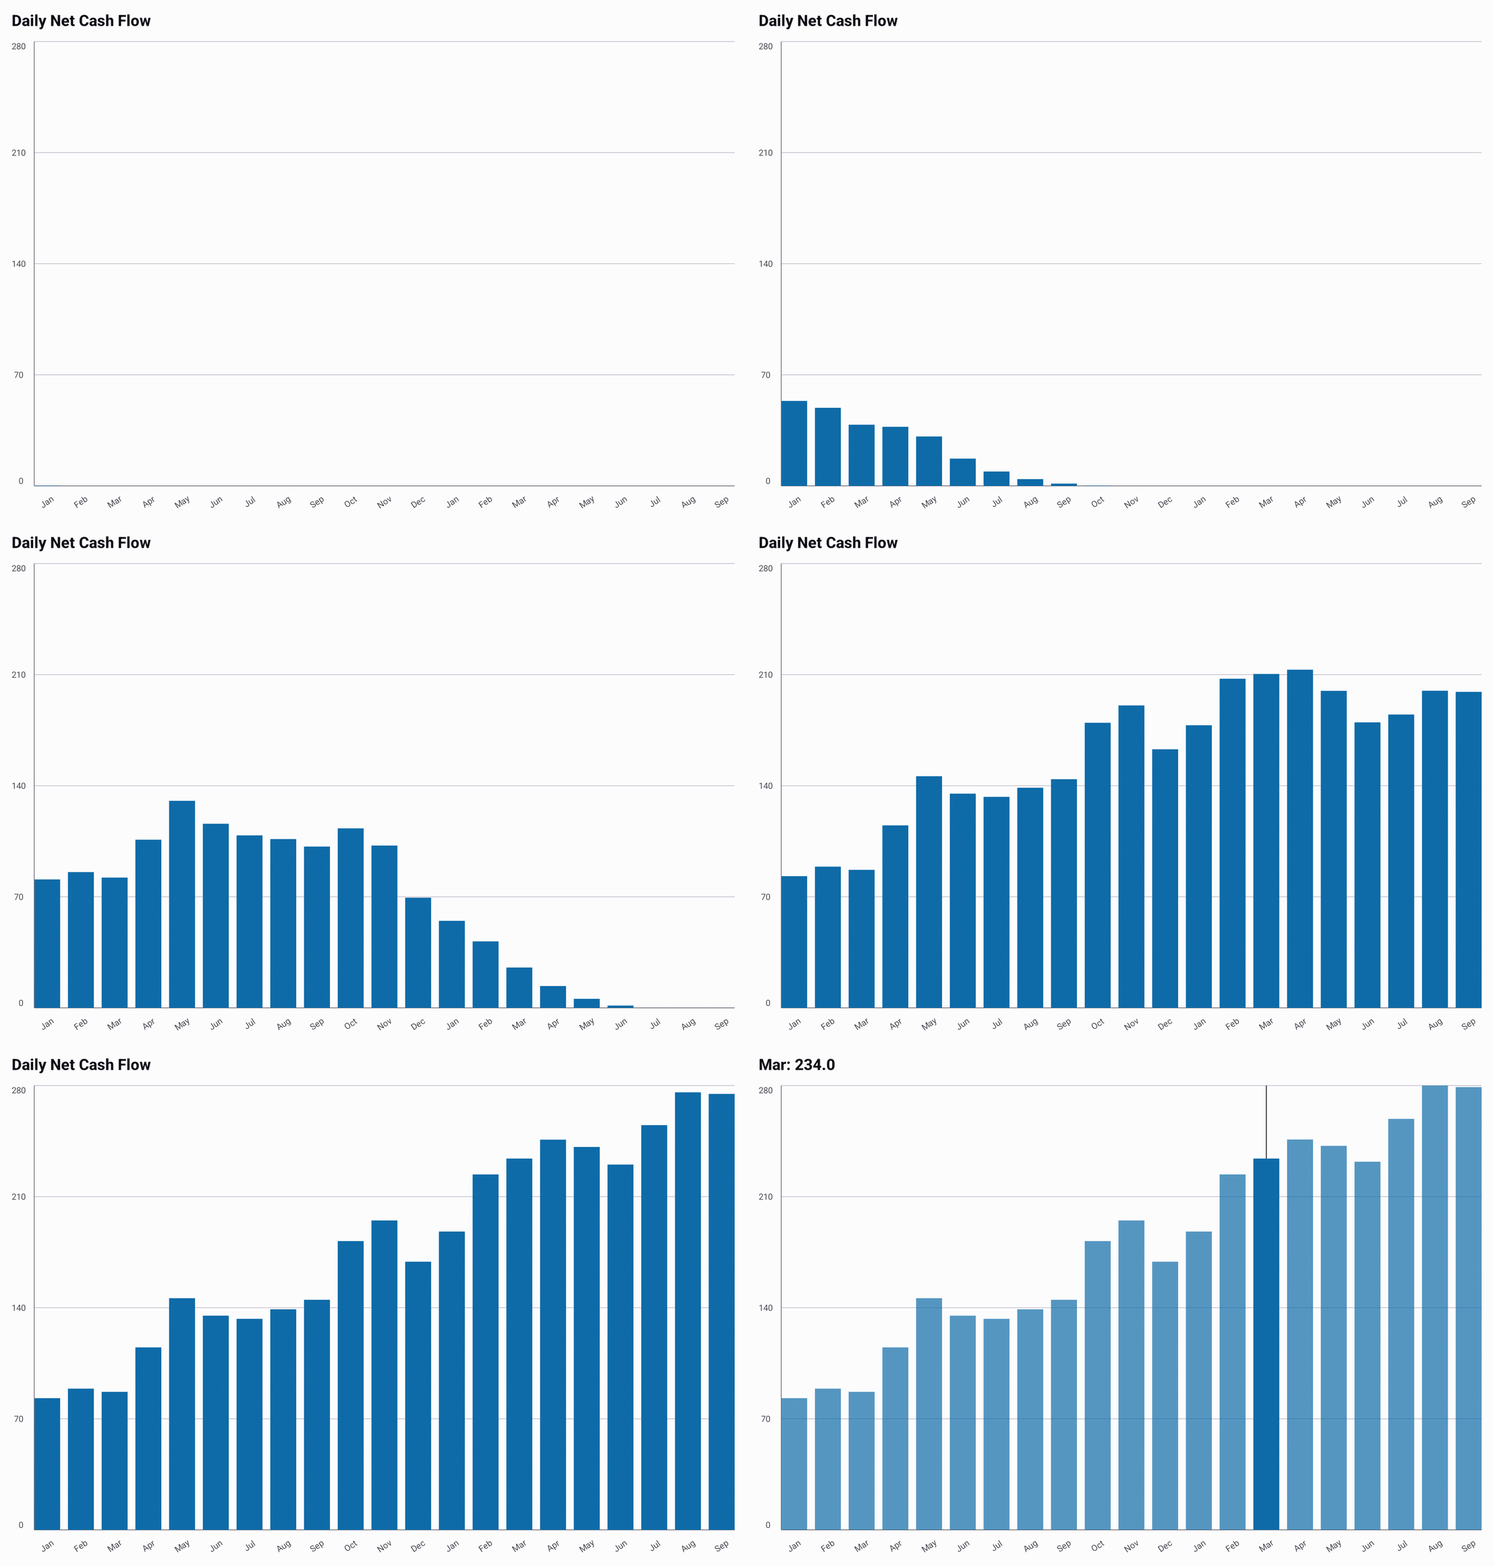
The example below is minimal and runs as written. The GIF above uses a longer generated
series; its full source is in
BarExample.kt.
@Composable
fun ShowBar() {
    val data = listOf(45.0, -12.0, 38.0, 27.0, -19.0, 42.0, 31.0).toChartData(
        categories = listOf("Mon", "Tue", "Wed", "Thu", "Fri", "Sat", "Sun"),
        seriesName = "Net cash flow",
    )

    BarChart(data = data, title = "Daily Net Cash Flow")
}
Fixed Y-Axis Range
By default the Y-axis is derived from the data, which can make small fluctuations look
exaggerated when the axis doesn't start at zero. Set range on BarChartDefaults.style()
to pin min, max, or both, independently of one another; whichever bound you leave null
keeps deriving from the data.
@Composable
fun ShowBarWithRange() {
    val data = listOf(45.0, -12.0, 38.0, 27.0, -19.0, 42.0, 31.0).toChartData(
        categories = listOf("Mon", "Tue", "Wed", "Thu", "Fri", "Sat", "Sun"),
        seriesName = "Net cash flow",
    )

    BarChart(
        data = data,
        title = "Daily Net Cash Flow",
        style = BarChartDefaults.style(
            range = BarChartDefaults.range(min = -50.0, max = 50.0),
        ),
    )
}
Gradients
Bars take a linear gradient through BarChartDefaults.bars(gradient = ...),
covered in Gradients.