
Gradients
The charts below paint their shapes, such as bars, area layers, or lines, with a
ChartGradient passed to the gradient parameter of their style.
A gradient runs along a line through any number of colors, and draws either per shape or across
the whole plot.
Supported Charts
| Chart | Style parameter |
|---|---|
| Bar | BarChartDefaults.bars(gradient = ...) |
| Histogram | HistogramChartDefaults.bars(gradient = ...) |
| Stacked Bar | StackedBarChartDefaults.segments(gradient = ...) |
| Stacked Area | StackedAreaChartDefaults.fill(gradient = ...) |
| Line | LineChartDefaults.line(gradient = ...) |
Other charts draw solid colors.
When a chart shows a legend, we currently recommend only gradients built from series colors, such
as ChartGradients.fade(). They keep each series' color, so readers can match shapes to the
legend. A gradient through fixed colors paints every series alike.
Use
Pass a ChartGradient to bars(). ChartGradients builds the common ones from a list of
colors.
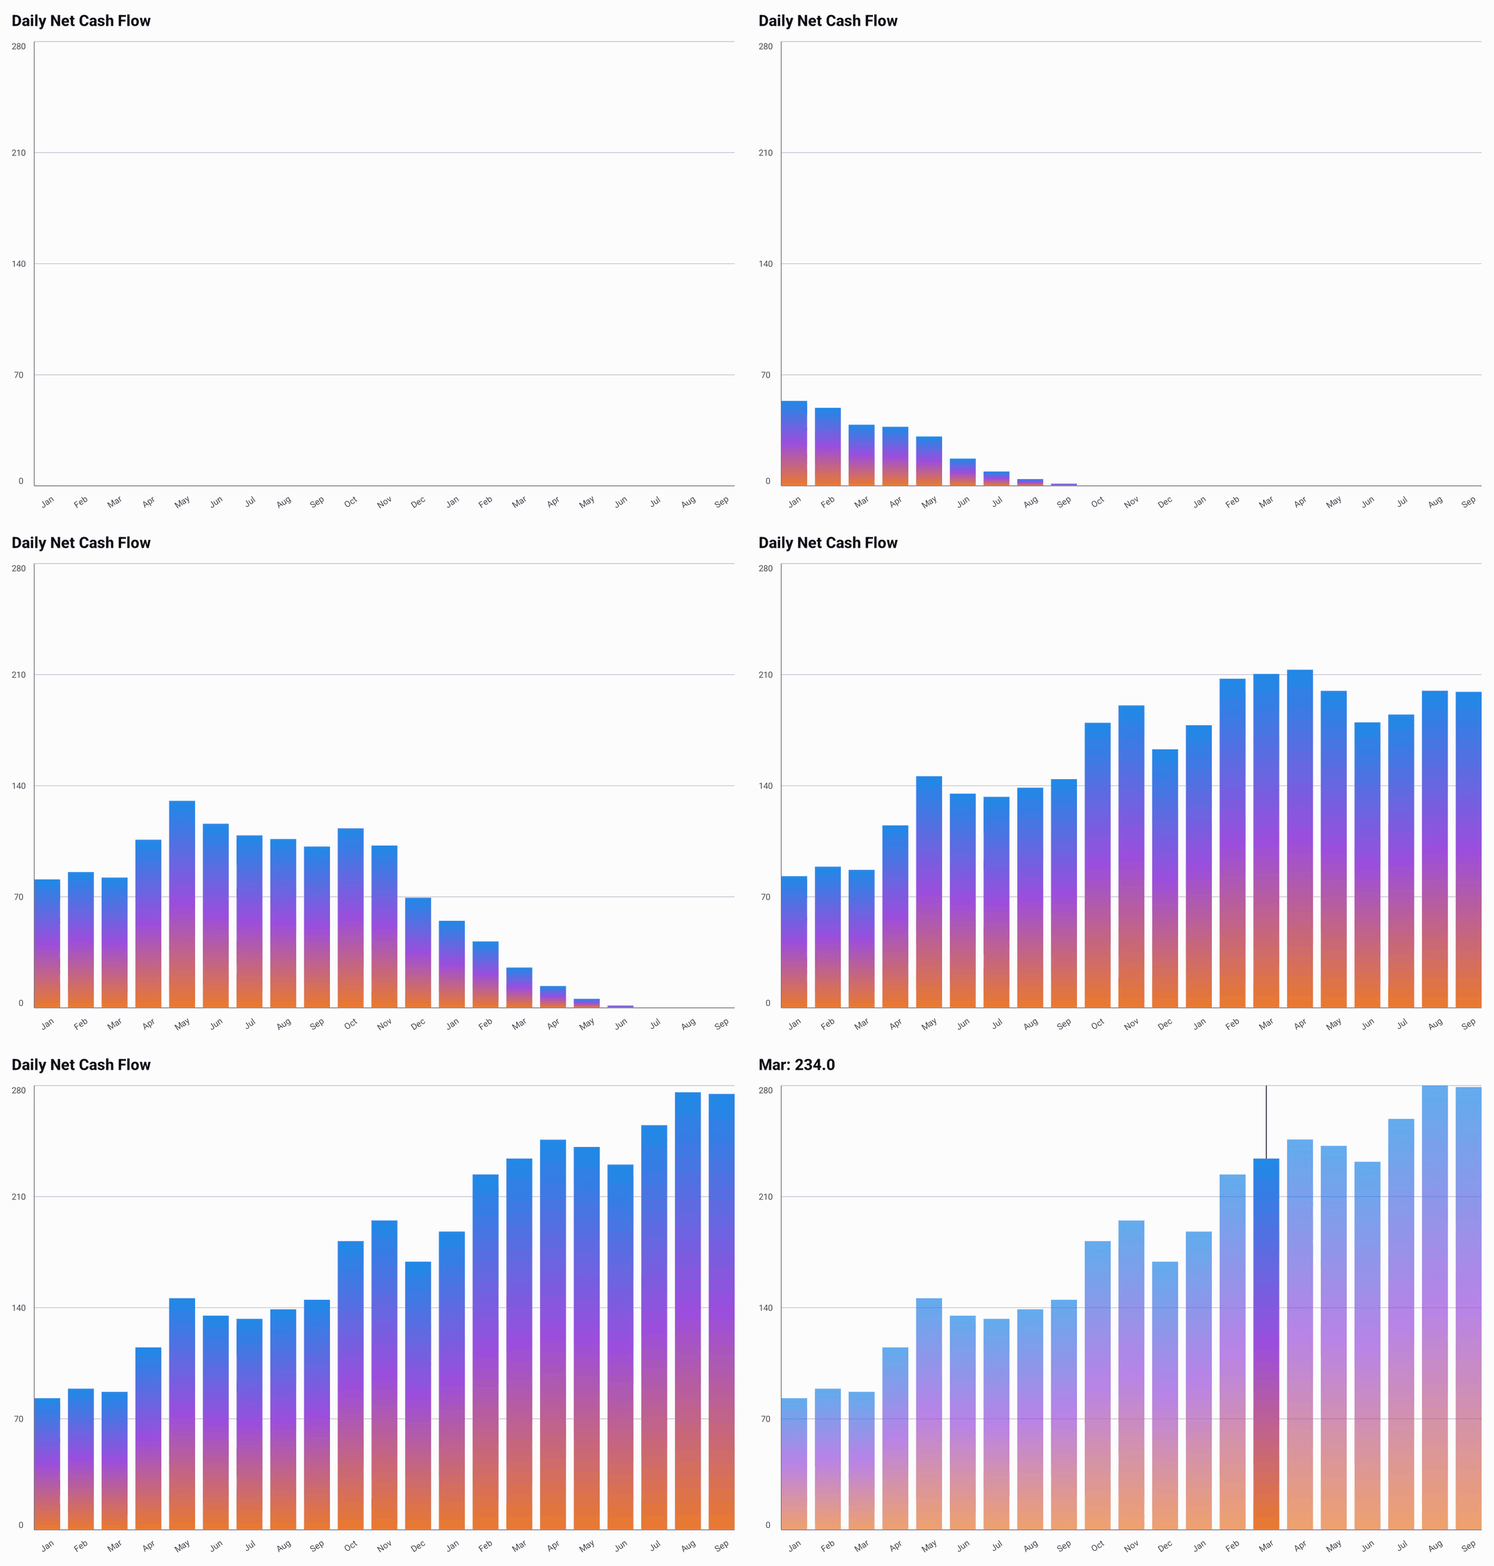
The example below is minimal and runs as written. The GIF above uses a longer generated
series; its full source is in
BarGradientExample.kt.
@Composable
fun ShowGradientBar() {
    val data = listOf(45.0, -12.0, 38.0, 27.0, -19.0, 42.0, 31.0).toChartData(
        categories = listOf("Mon", "Tue", "Wed", "Thu", "Fri", "Sat", "Sun"),
        seriesName = "Net cash flow",
    )
    val gradient = ChartGradients.vertical(
        colors = listOf(Color(0xFF1E89E6), Color(0xFF9B4EDD), Color(0xFFEA7A2E)),
    )
    val bars = BarChartDefaults.bars(gradient = gradient)

    BarChart(
        data = data,
        title = "Daily Net Cash Flow",
        style = BarChartDefaults.style(bars = bars),
    )
}
A style without a gradient draws solid bars.
Per Bar or Across the Plot
A gradient draws in one of two ways, set by its span:
span | Drawing |
|---|---|
GradientSpan.Shape | Per shape: every shape shows the whole gradient. This is the default. |
GradientSpan.Plot | Across the plot: one gradient covers the whole plot, and each shape shows the part it sits on. |
Per Bar
Each bar draws the whole gradient within its own bounds, so every bar looks the same apart from its height. A vertical gradient runs from the bar's end to the baseline. A bar below zero mirrors it, so it still runs from its end, at the bottom, up to the baseline.
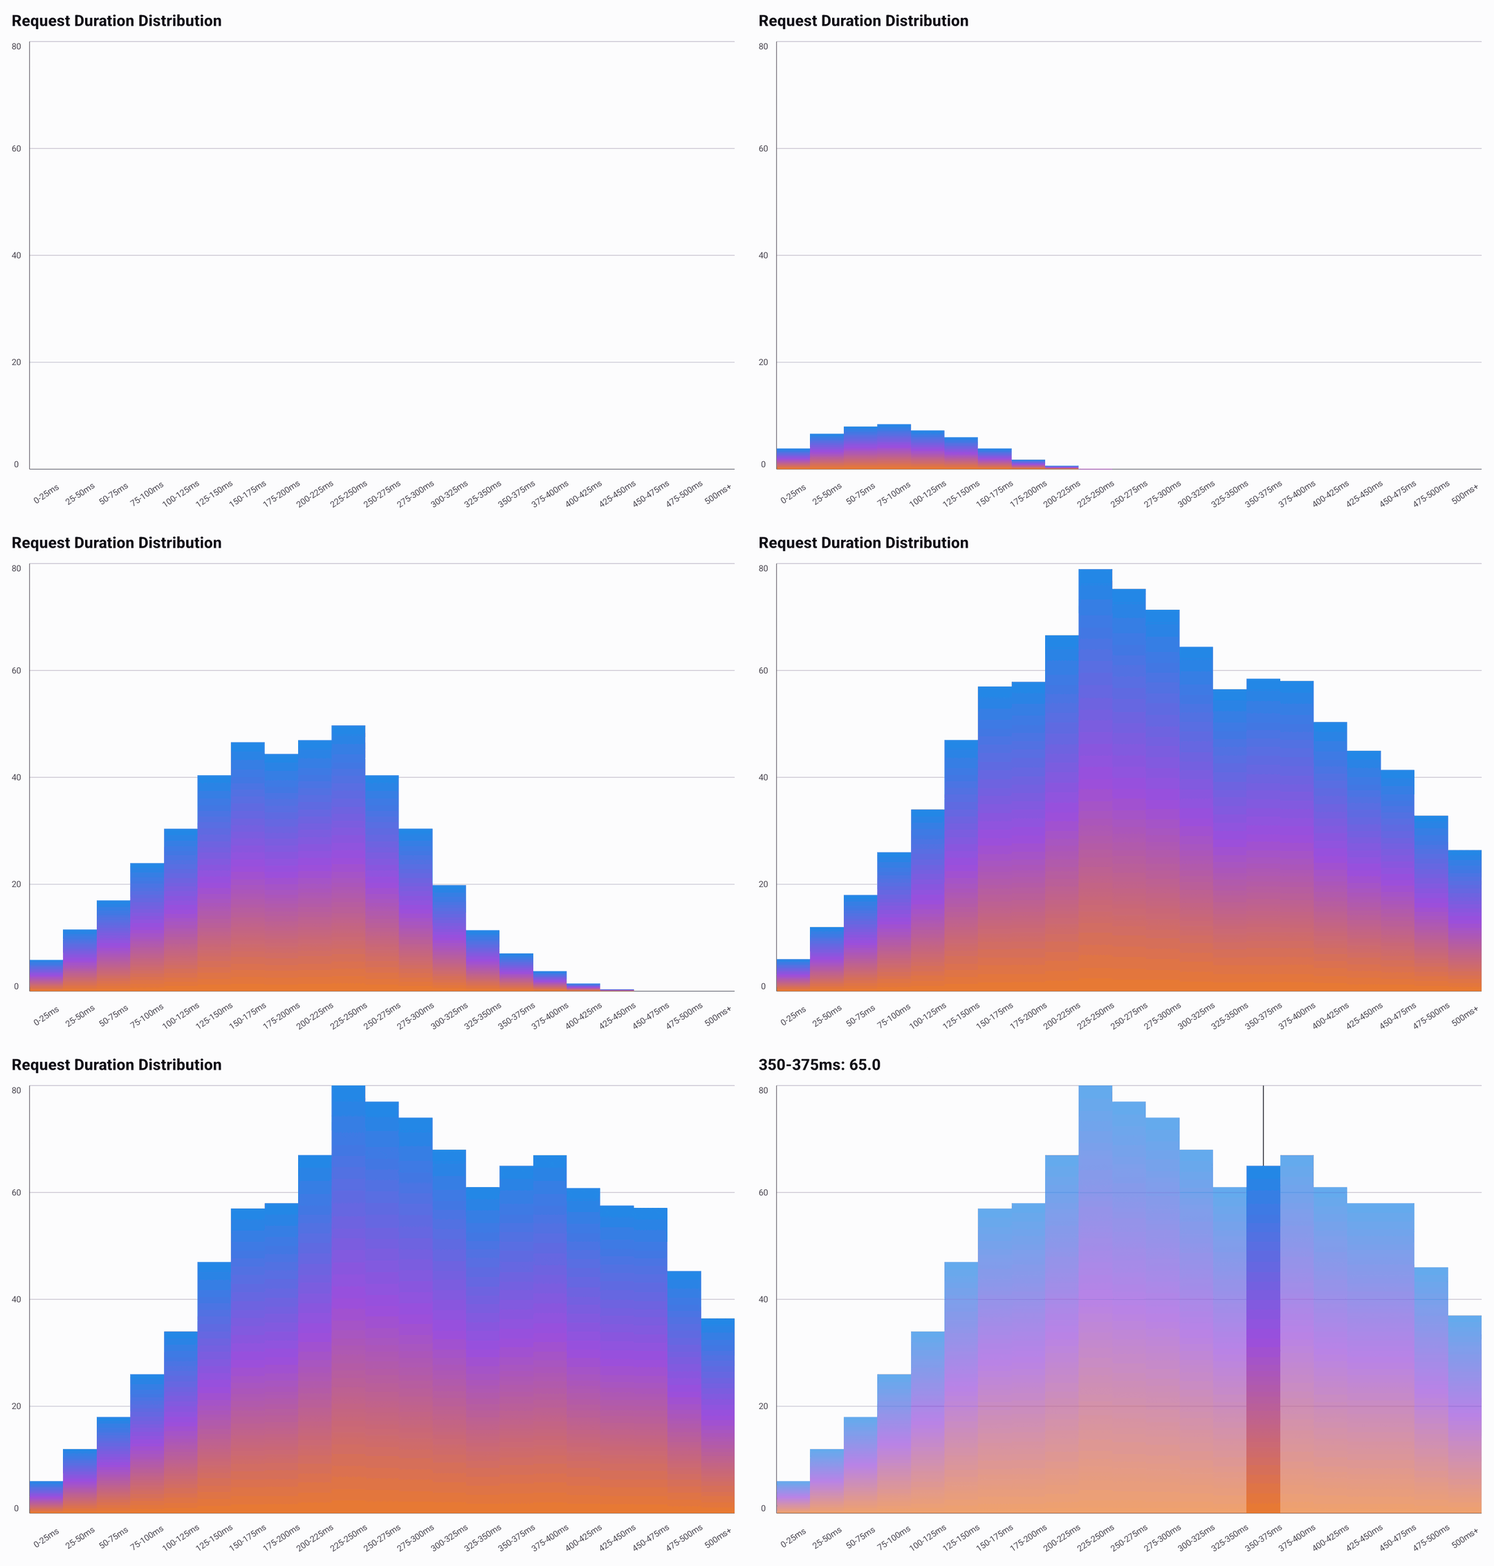
The GIF above draws the same gradient on a histogram; its full source is in
HistogramGradientExample.kt.
// Every bar and bin goes from blue at its end, through purple, to orange at the baseline.
val gradient = ChartGradients.vertical(
    colors = listOf(Color(0xFF1E89E6), Color(0xFF9B4EDD), Color(0xFFEA7A2E)),
    span = GradientSpan.Shape,
)
BarChartDefaults.bars(gradient = gradient)
HistogramChartDefaults.bars(gradient = gradient)
Across the Plot
One gradient covers the whole plot, and each bar shows the part of it the bar sits on. A horizontal gradient moves from the first bar's color to the last bar's color. A vertical one gives taller bars more of the top color, so the color follows the value.
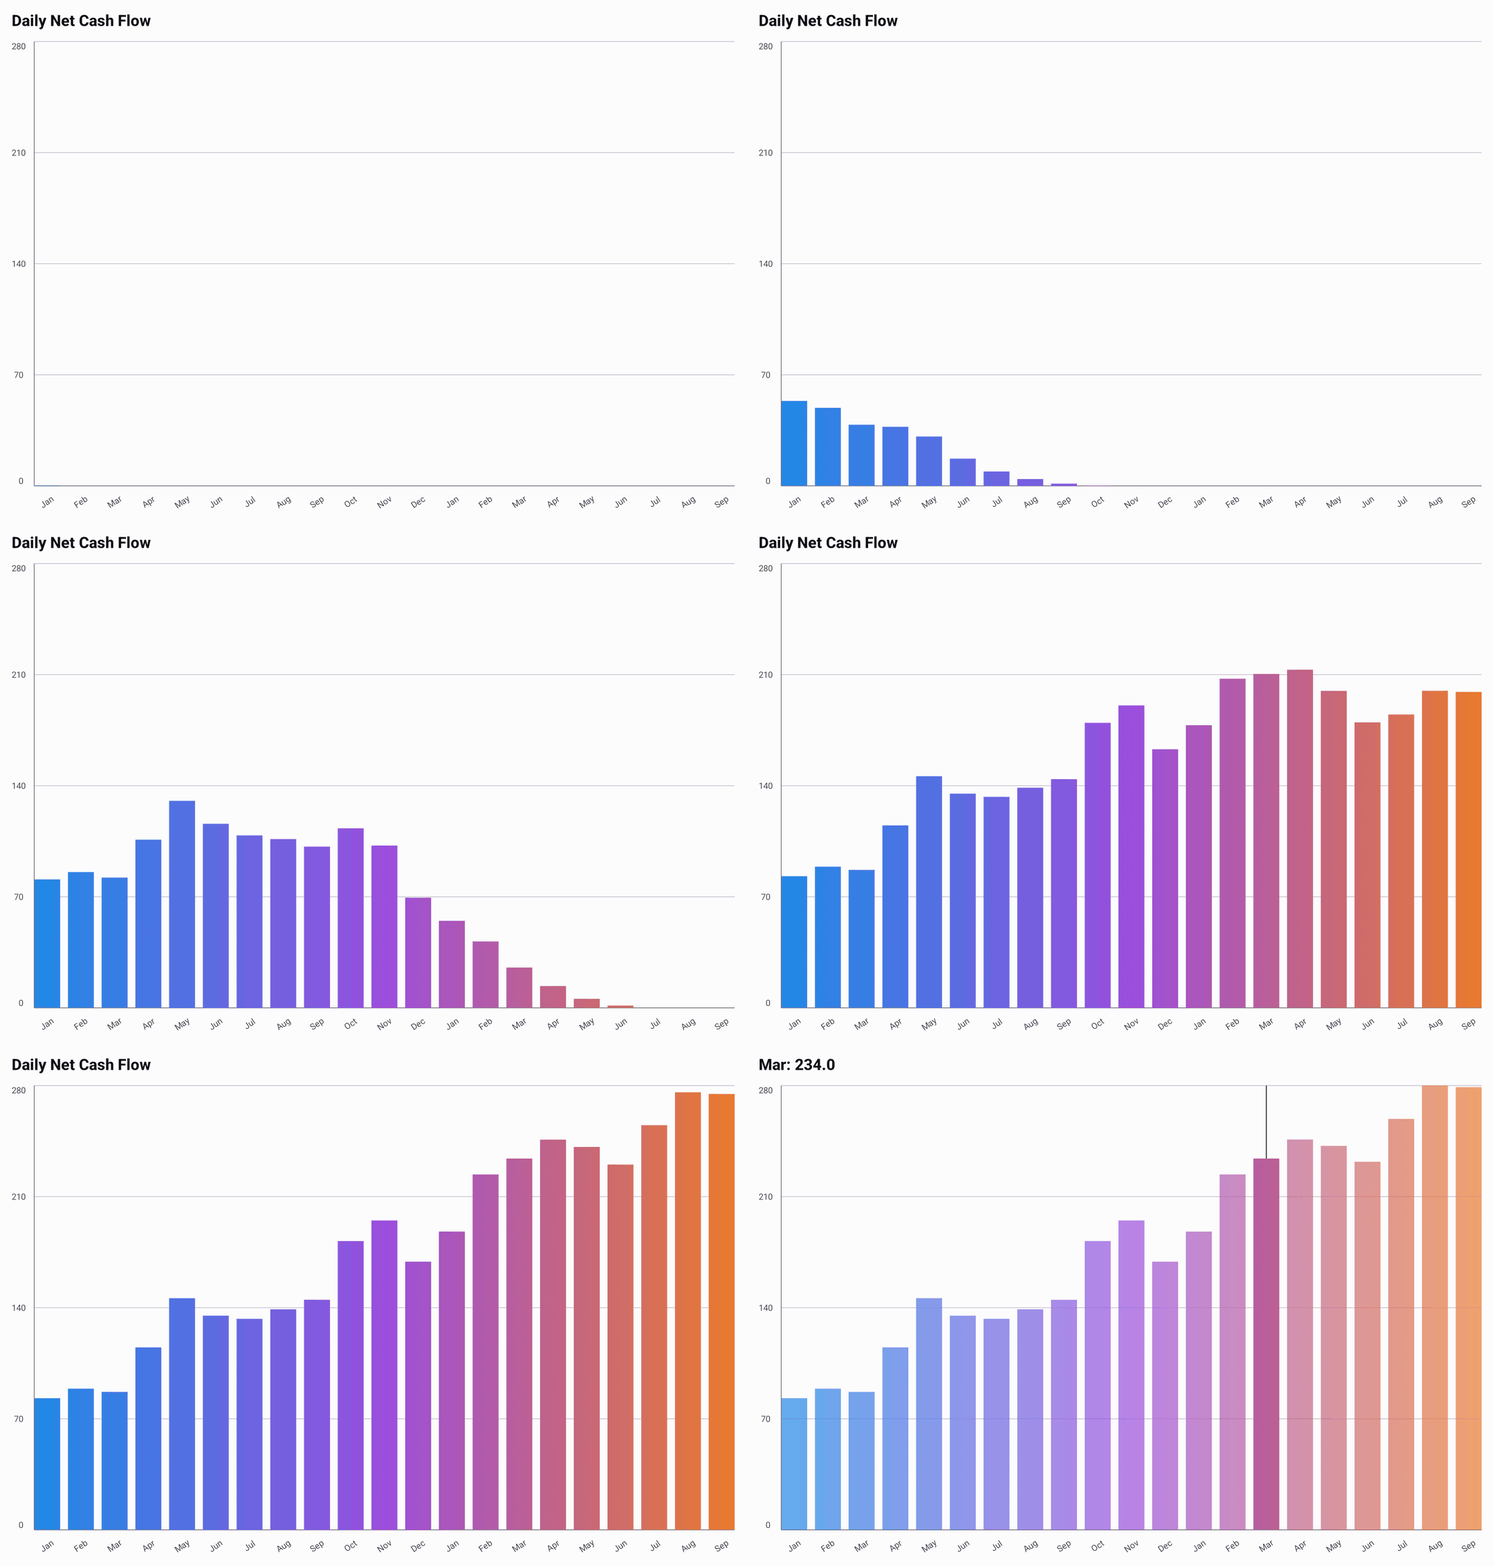
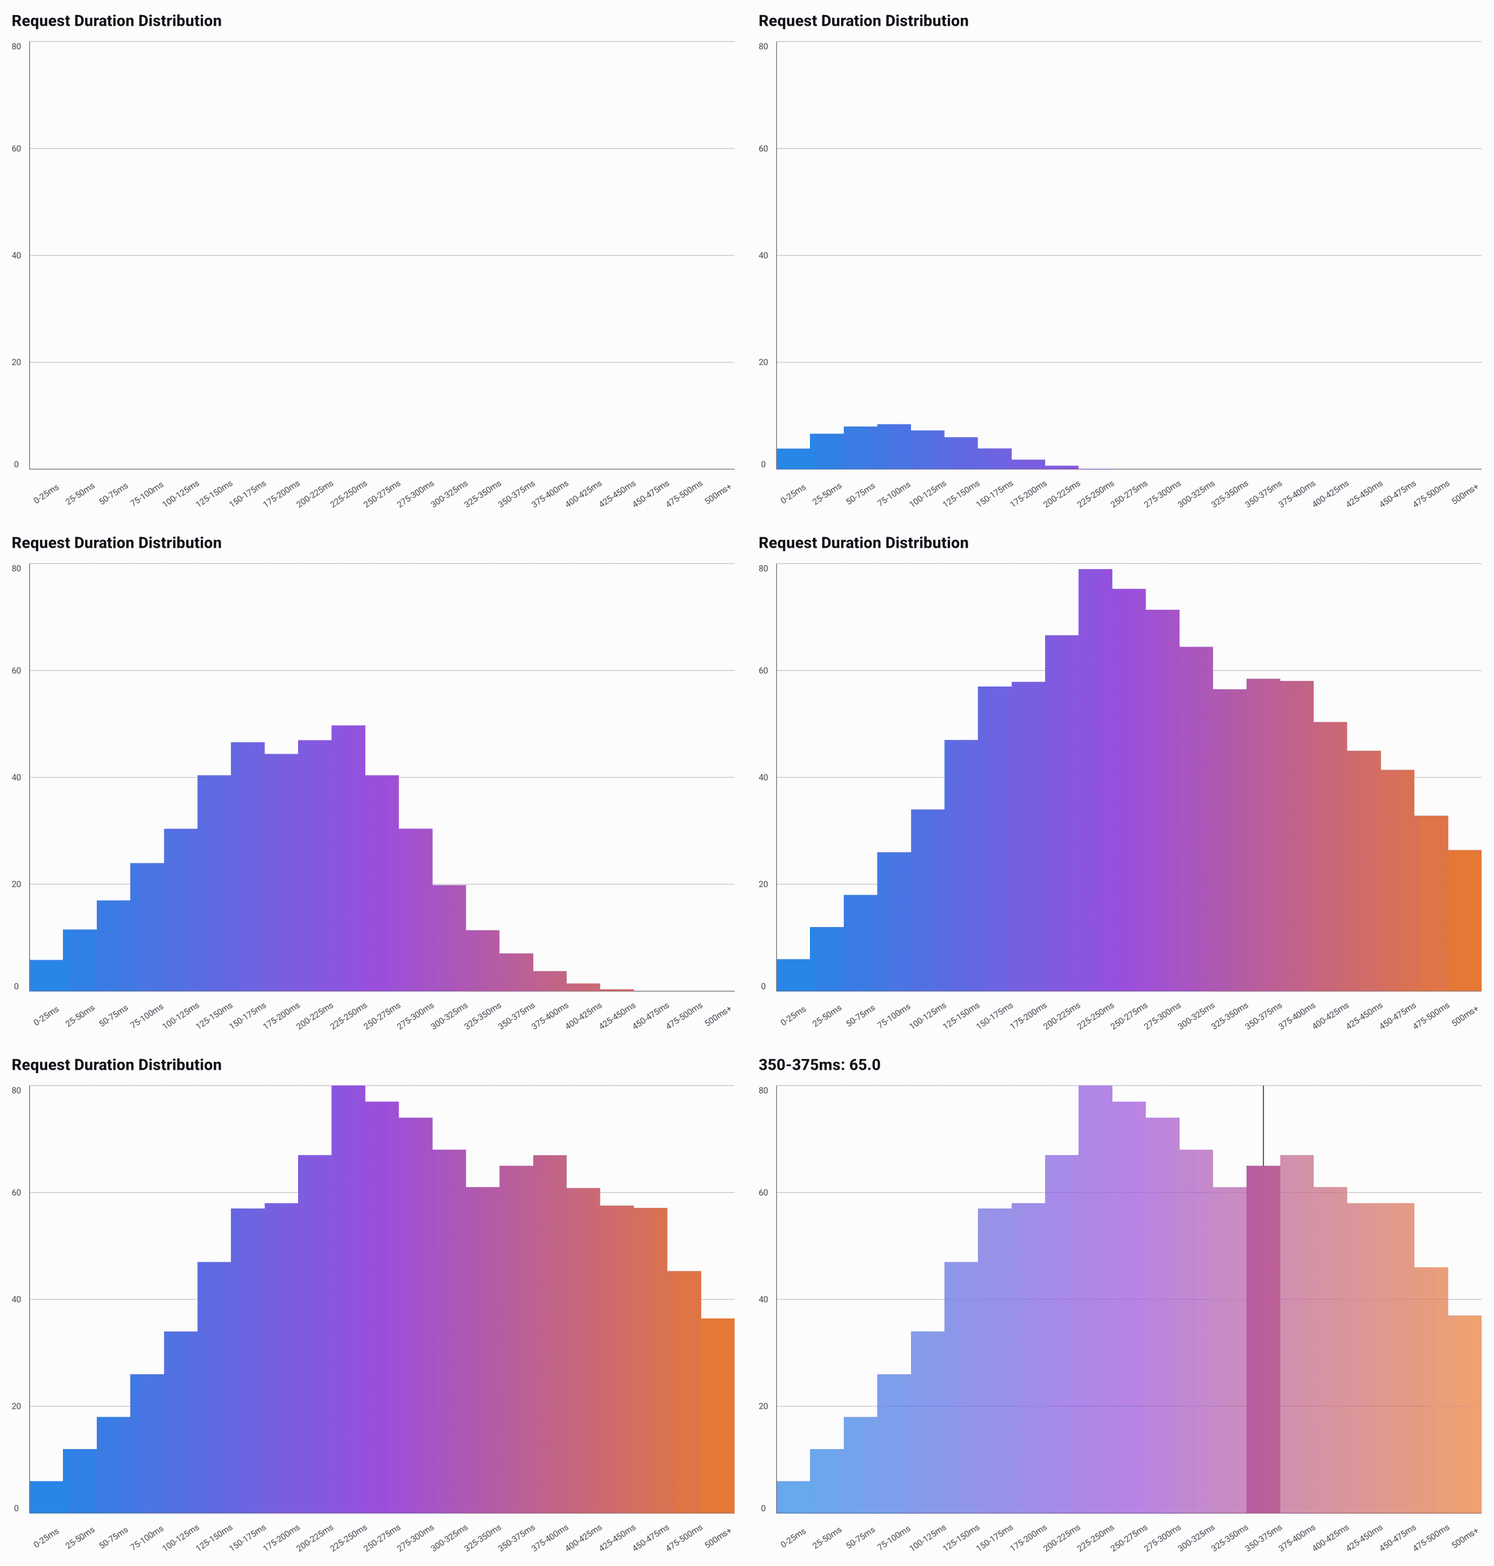
The GIFs in this section use longer generated series; their full source is in
BarGradientExample.kt and
HistogramGradientExample.kt.
// The first bar is blue, the last bar is orange, and the bars between blend through purple.
val gradient = ChartGradients.horizontal(
    colors = listOf(Color(0xFF1E89E6), Color(0xFF9B4EDD), Color(0xFFEA7A2E)),
    span = GradientSpan.Plot,
)
BarChartDefaults.bars(gradient = gradient)
HistogramChartDefaults.bars(gradient = gradient)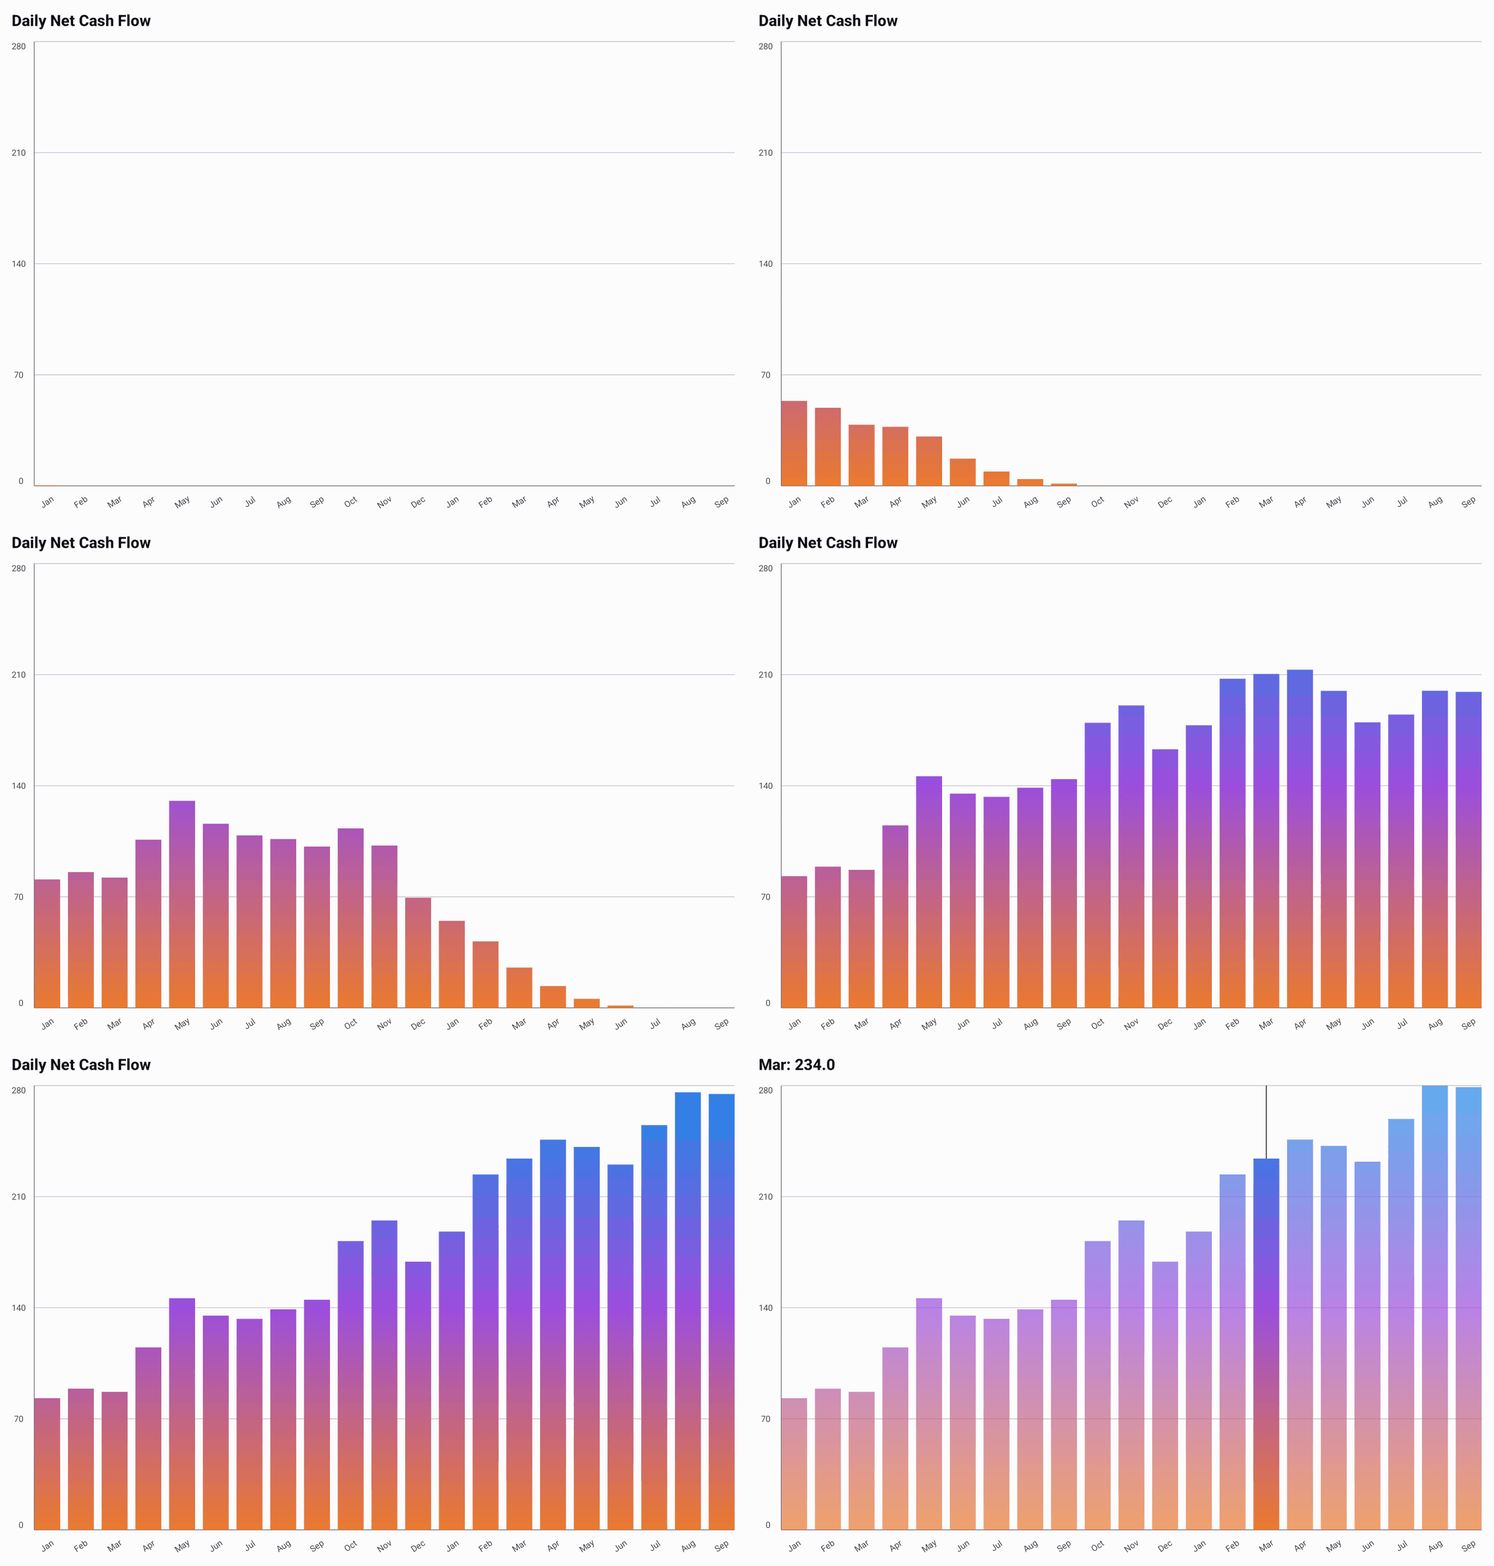
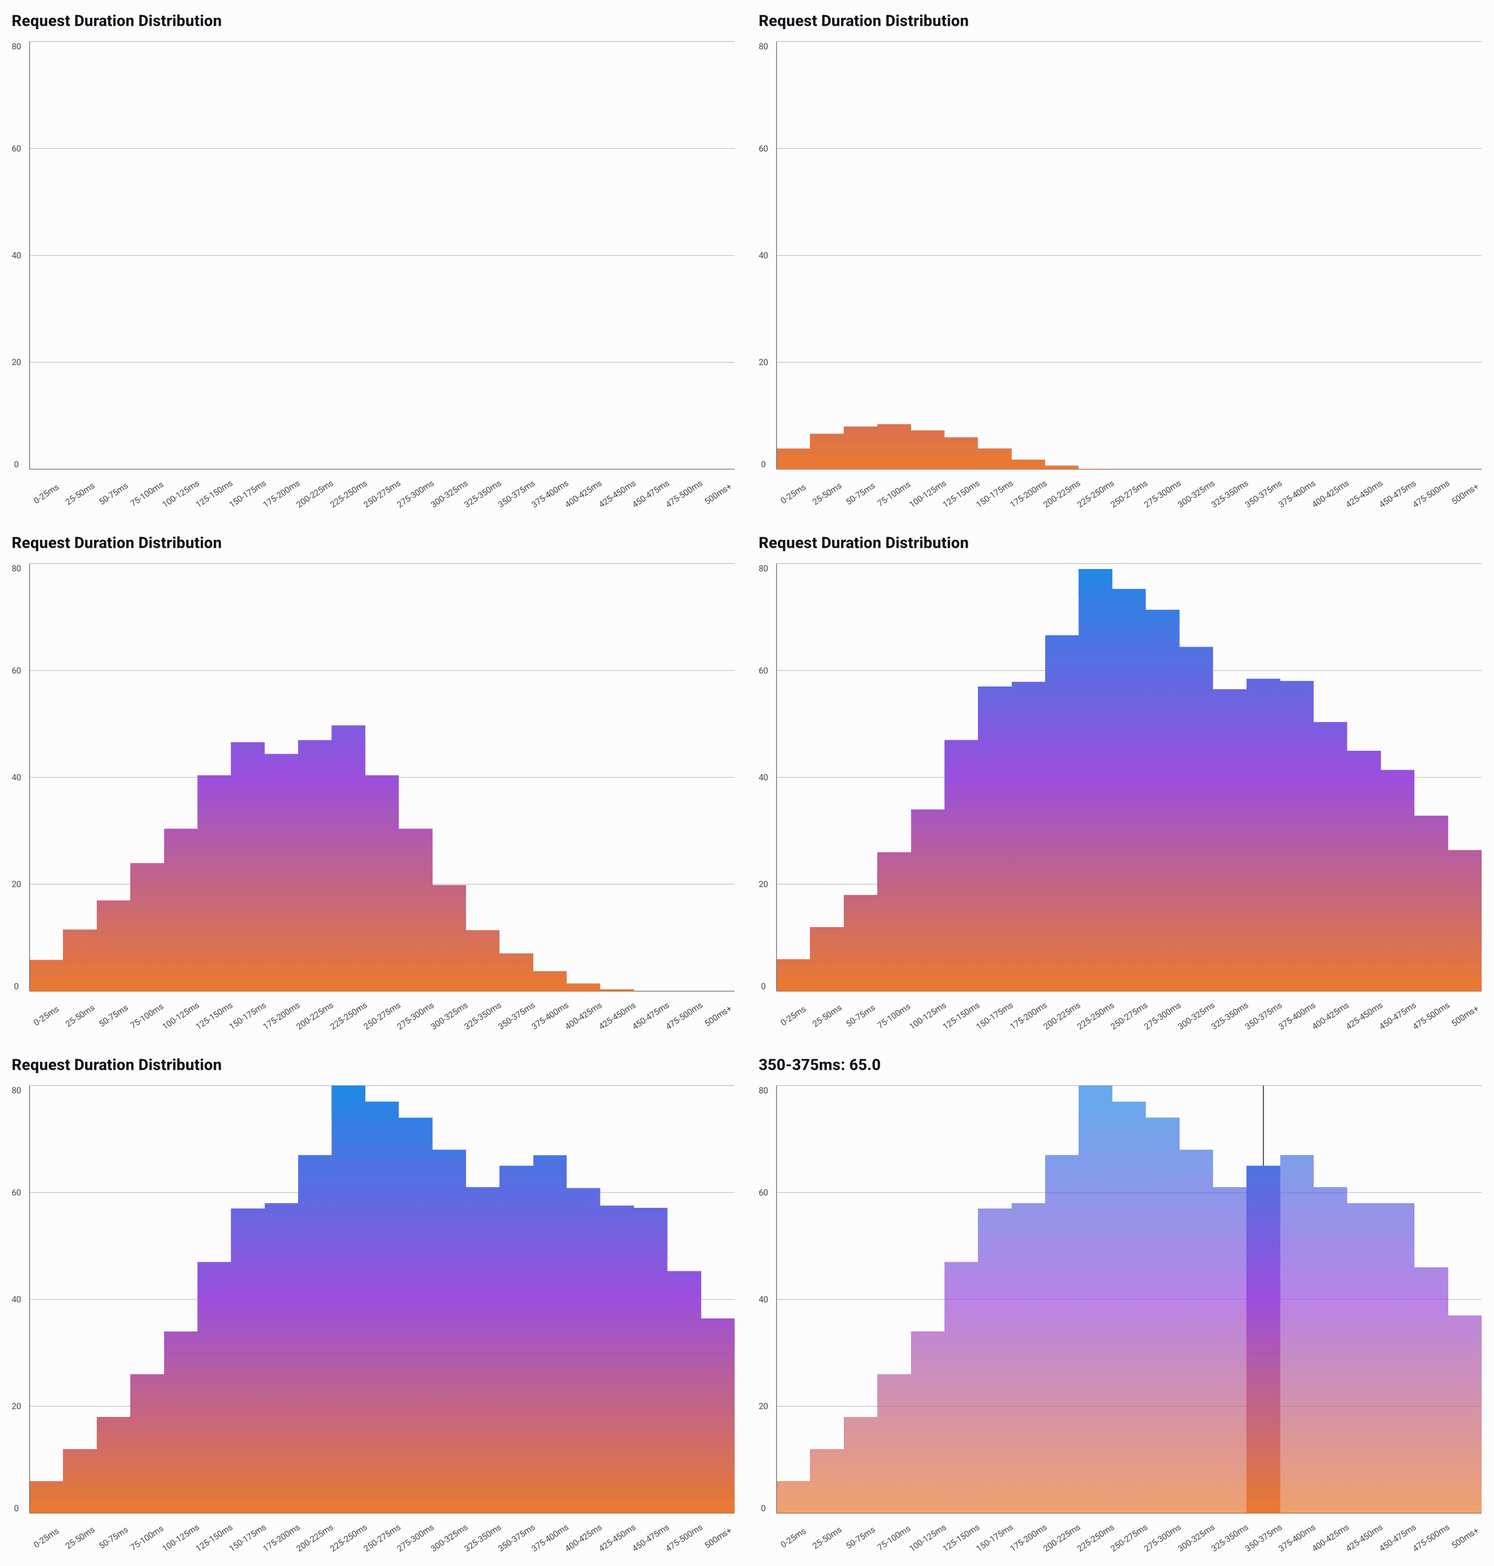
// Tall bars reach into blue; short bars stay orange.
val gradient = ChartGradients.vertical(
    colors = listOf(Color(0xFF1E89E6), Color(0xFF9B4EDD), Color(0xFFEA7A2E)),
    span = GradientSpan.Plot,
)
BarChartDefaults.bars(gradient = gradient)
HistogramChartDefaults.bars(gradient = gradient)
When dense data is expanded to scroll, the plot gradient covers every bar and scrolls with them.
Stacked Bar Segments
Pass a shared gradient to StackedBarChartDefaults.segments(gradient = ...) to apply it to every
segment. Each segment still keeps its resolved series color when the gradient uses
GradientStop.Series, such as ChartGradients.fade(). Stacked bars do not support separate
gradients per series.
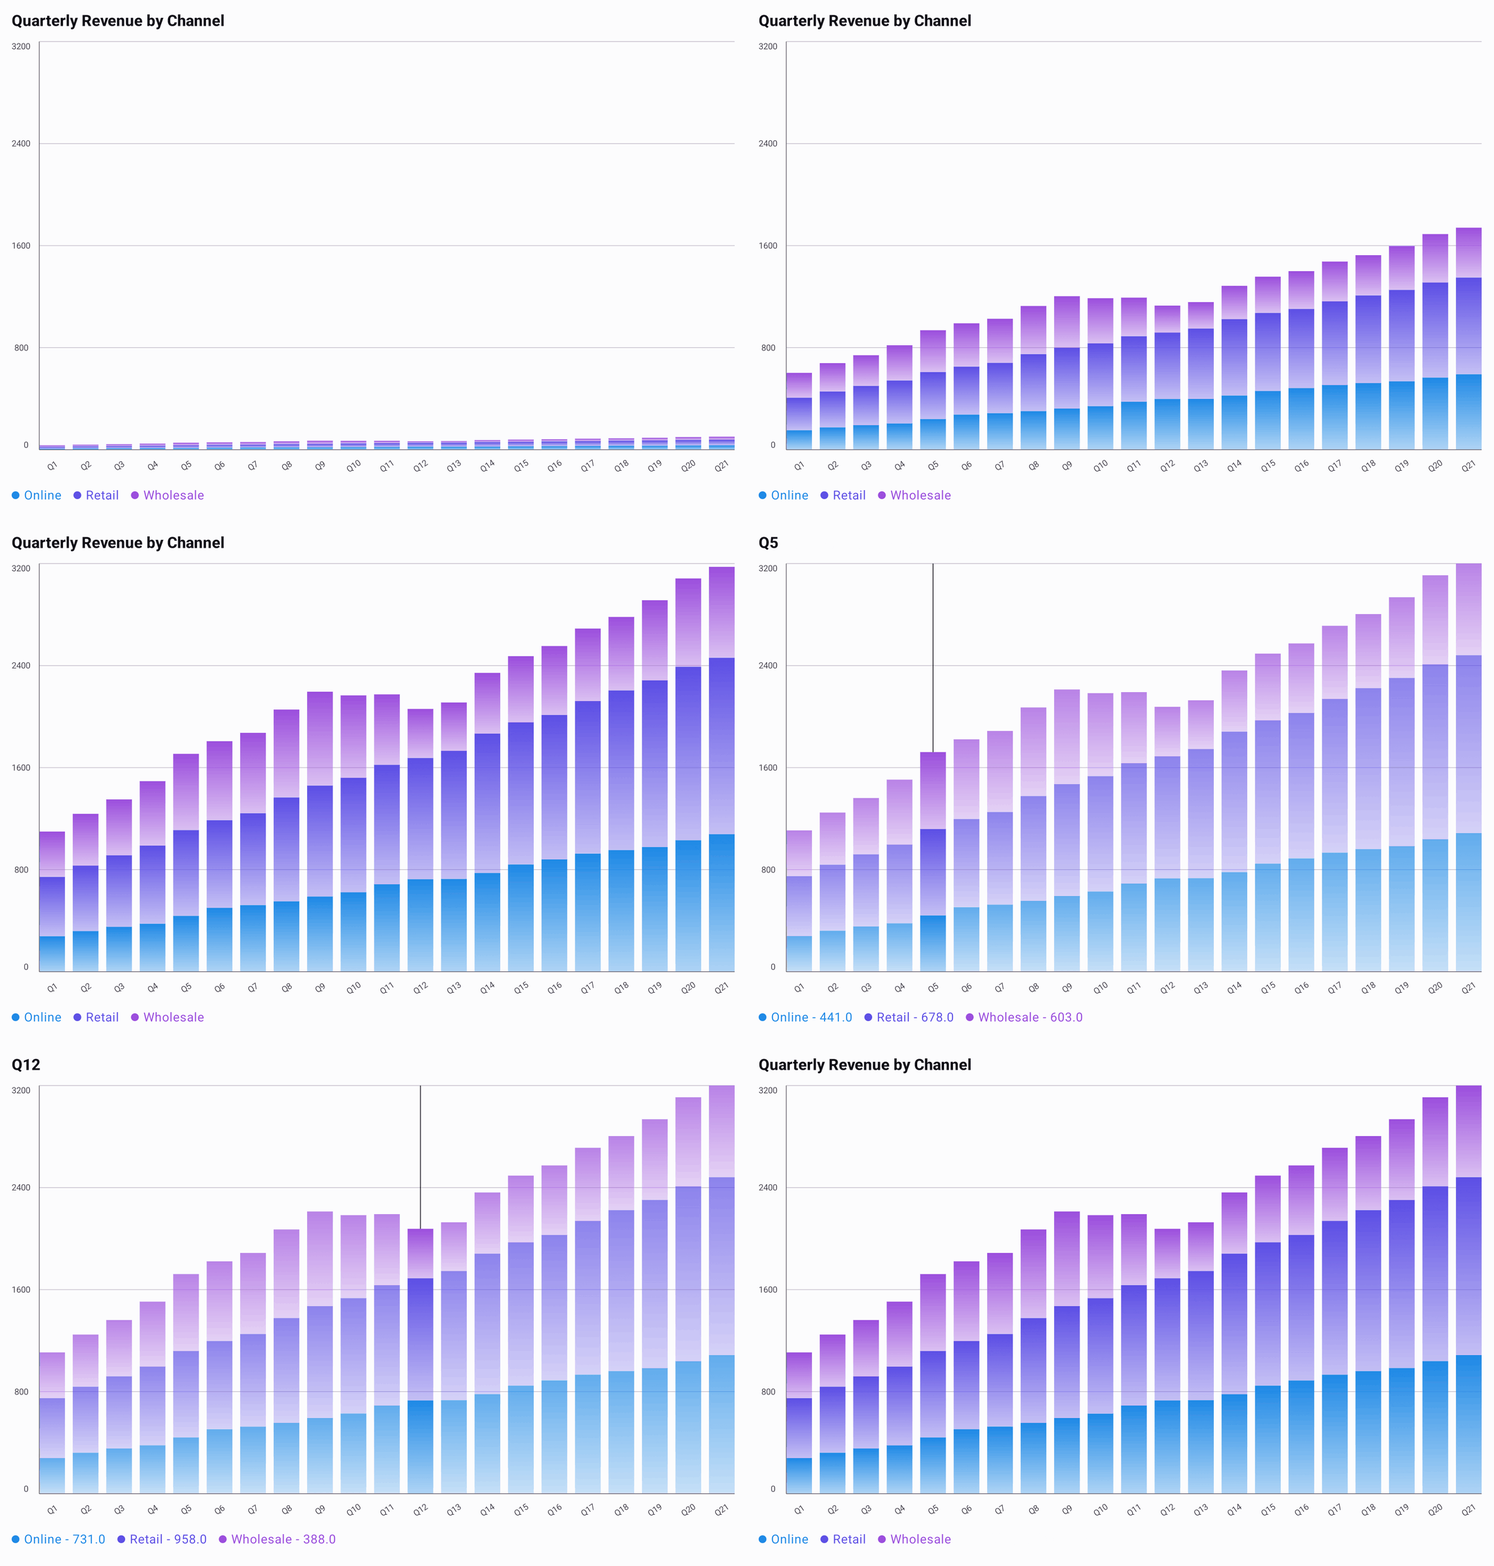
The GIF above uses a longer generated series per channel; its full source is in
StackedBarGradientExample.kt.
StackedBarChartDefaults.segments(
    colors = listOf(Color(0xFF1E89E6), Color(0xFF5C4EE5), Color(0xFF9B4EDD)),
    gradient = ChartGradients.fade(endAlpha = 0.35f),
)
Stacked Area Layers
Pass a shared gradient to StackedAreaChartDefaults.fill(gradient = ...) to apply it to every layer.
ChartGradients.fade() keeps each layer tied to its series color while adding a vertical alpha fade.
GradientSpan.Shape covers each layer's full bounds. GradientSpan.Plot aligns the gradient to the
full scrolling plot bounds.
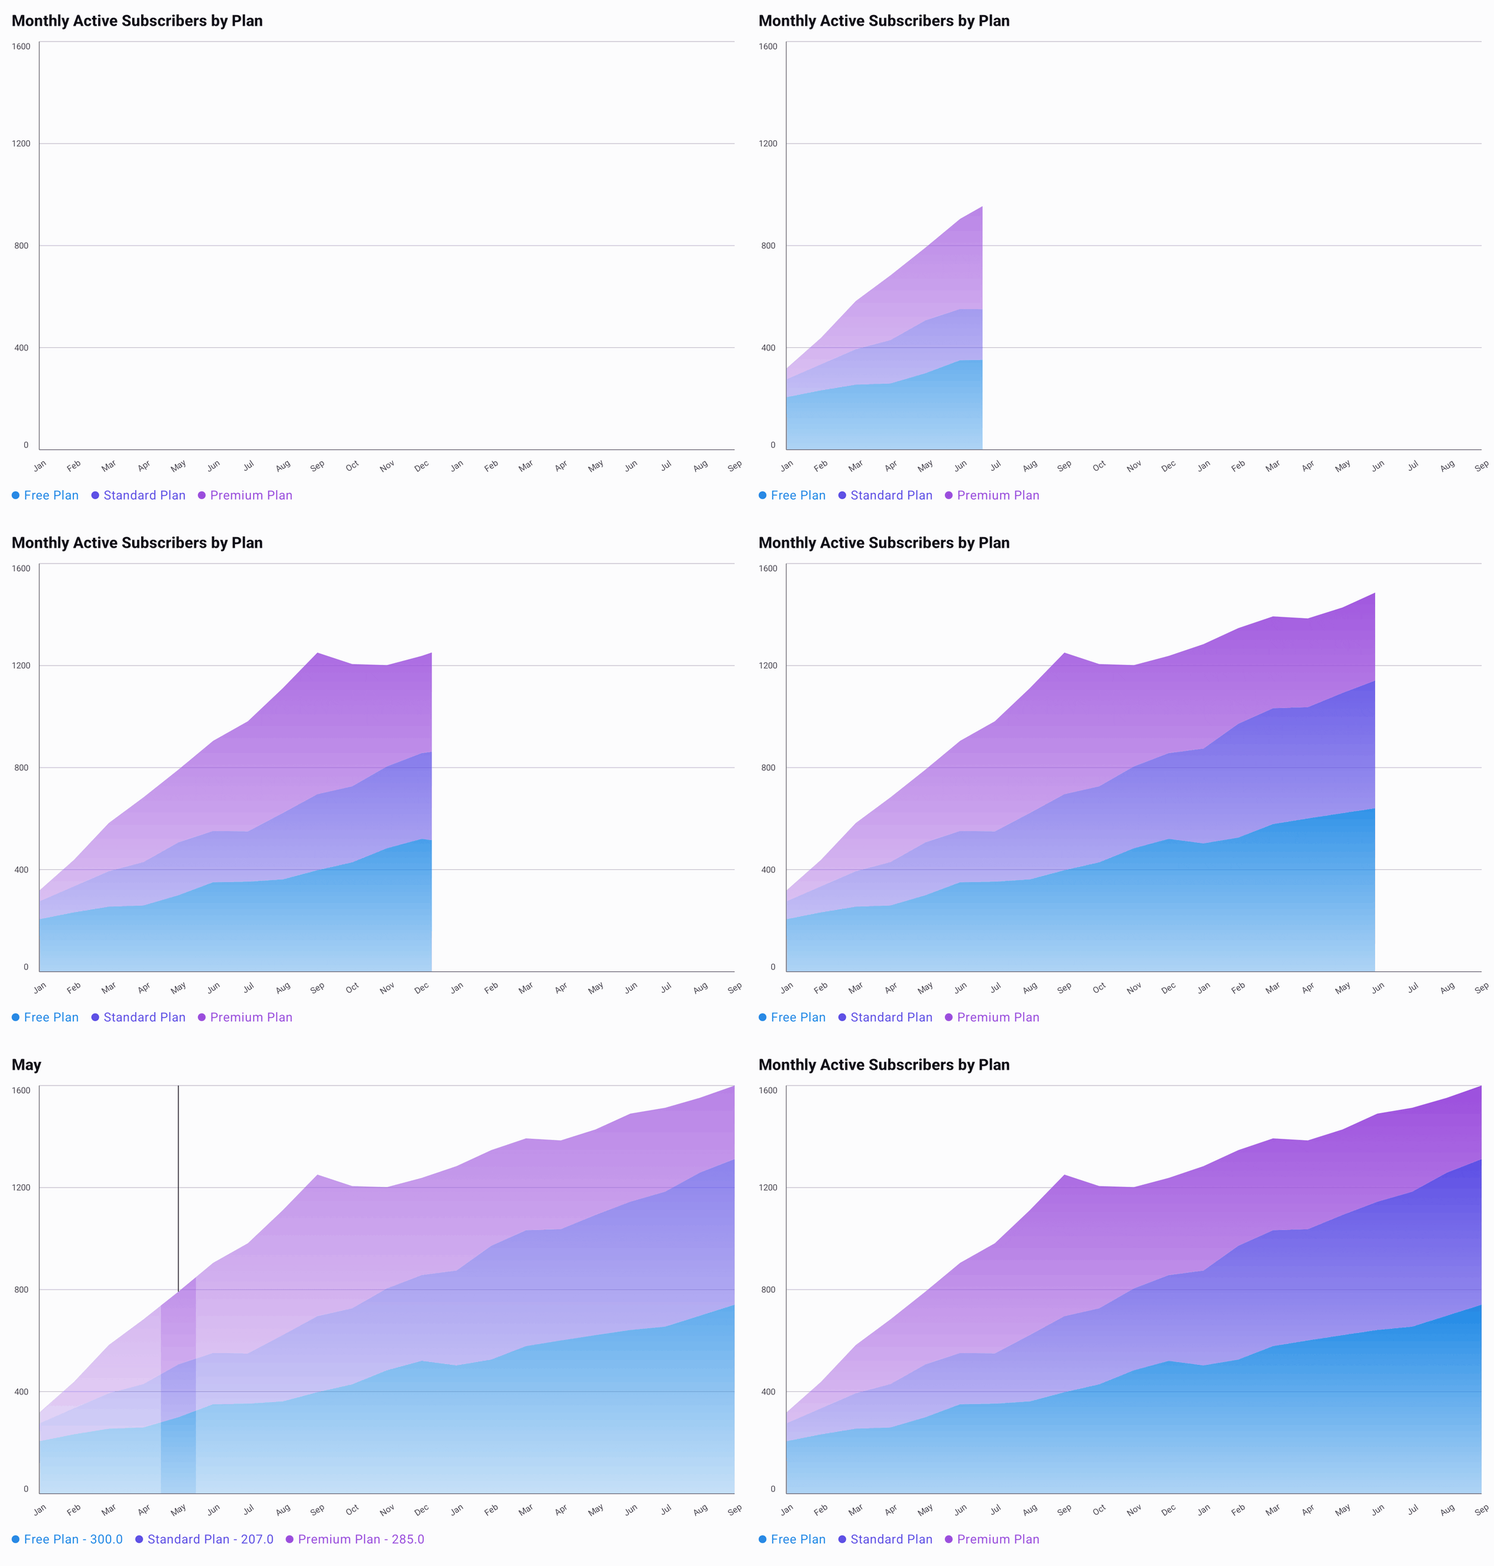
The GIF above uses a longer generated series per plan; its full source is in
StackedAreaGradientExample.kt.
StackedAreaChartDefaults.fill(
    colors = listOf(Color(0xFF1E89E6), Color(0xFF5C4EE5), Color(0xFF9B4EDD)),
    gradient = ChartGradients.fade(endAlpha = 0.35f),
)
Lines
Pass a gradient to LineChartDefaults.line(gradient = ...) to paint the line with it. The
gradient paints the stroke. Points and selection markers keep their own colors.
GradientSpan.Plotcovers the whole plot. A vertical gradient colors each part of the line by its value. When dense data is expanded to scroll, the gradient covers every point and scrolls with them.GradientSpan.Shapecovers the line's own bounds, from its first point to its last and from its lowest value to its highest. InLiveLineChart, the bounds stay at the plot edges while the line slides, and move smoothly to the new window's lowest and highest values.
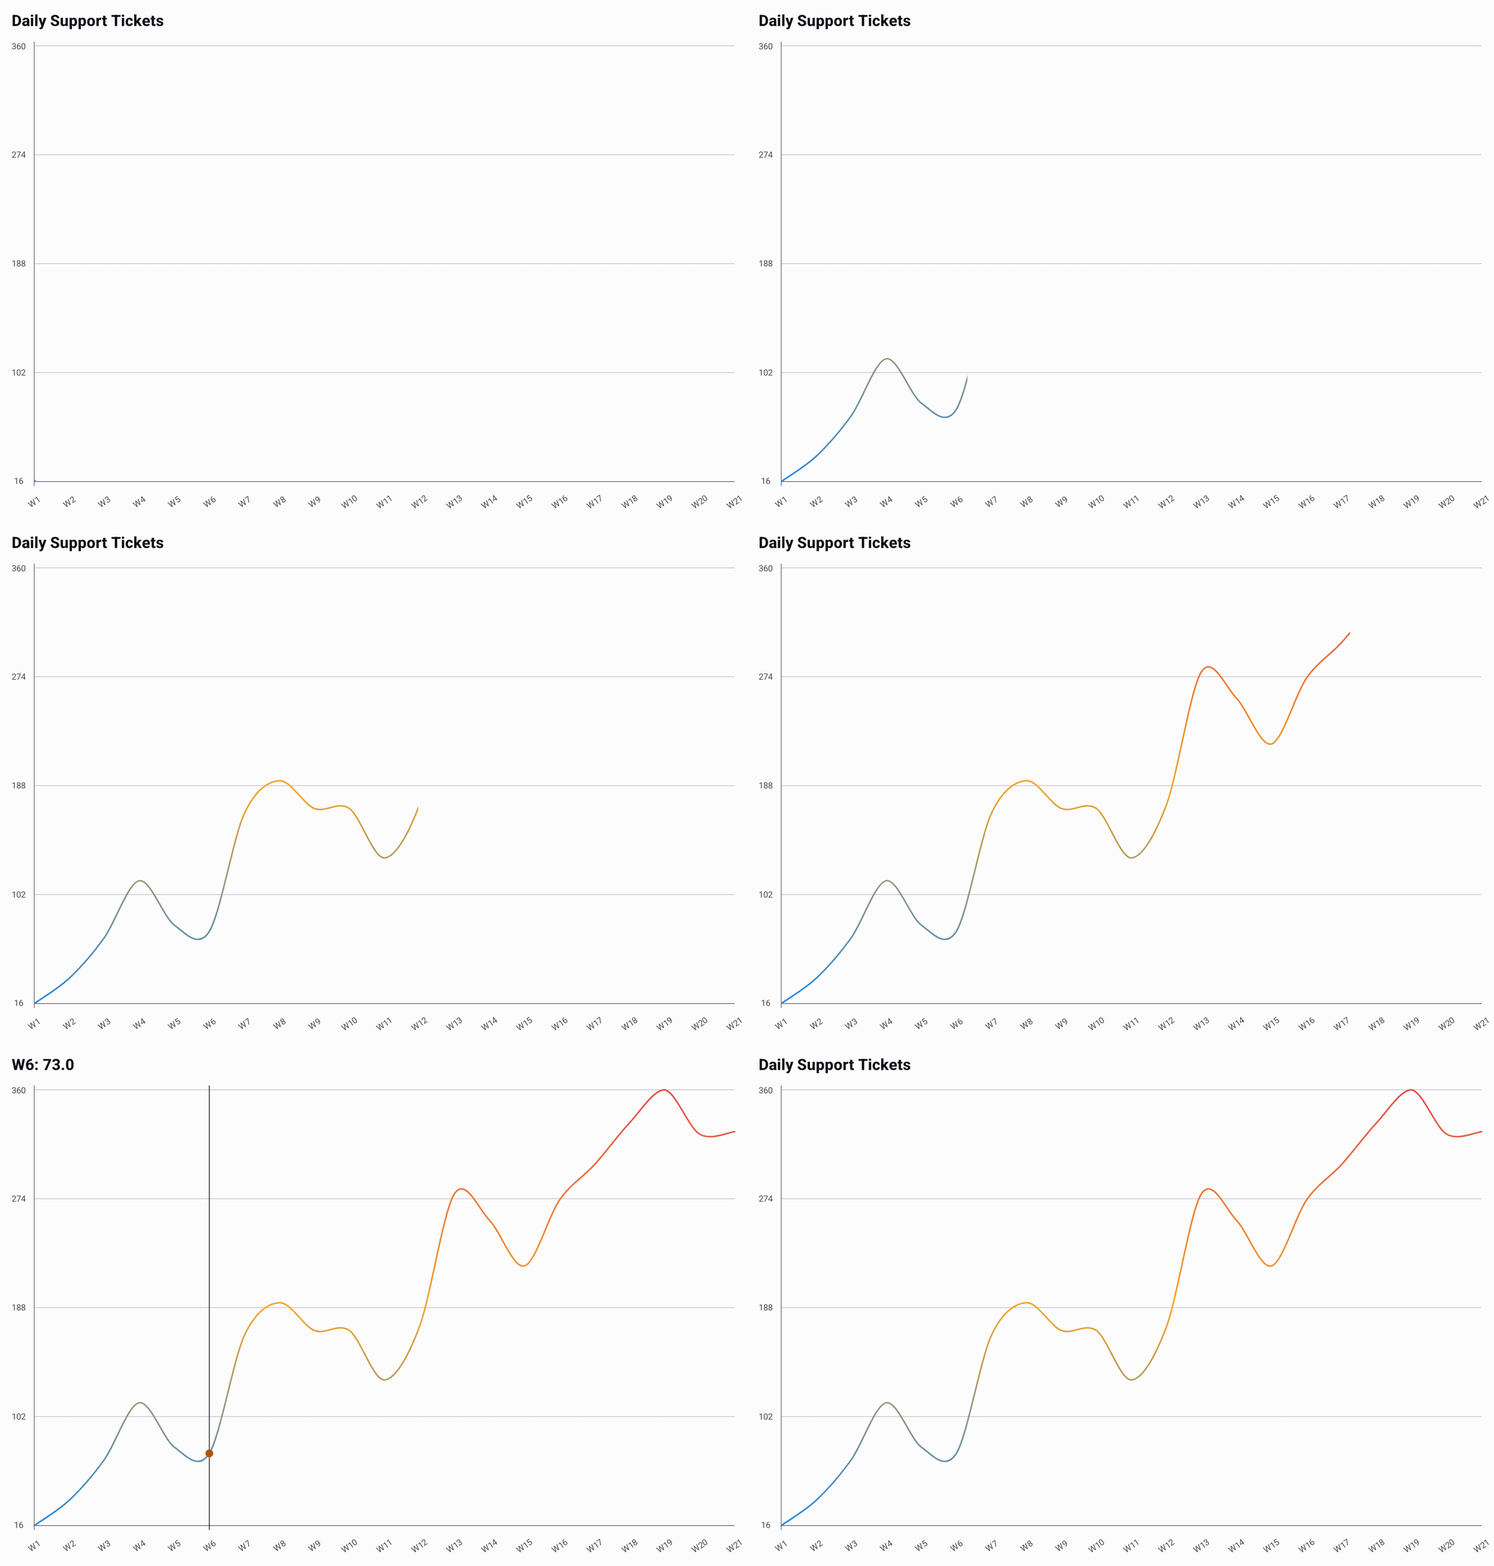
The GIF above uses a longer generated series; its full source is in
LineGradientExample.kt.
// High values are red, low values blue.
val gradient = ChartGradients.vertical(
    colors = listOf(Color(0xFFE5484D), Color(0xFFF5A524), Color(0xFF1E89E6)),
    span = GradientSpan.Plot,
)
LineChartDefaults.line(gradient = gradient)
ChartGradients.fade() fades from top to bottom, so the low parts of a line fade too.
Ready-Made Gradients
ChartGradients spaces the colors evenly along the gradient.
| Function | Gradient |
|---|---|
vertical(colors, span) | Top to bottom. With GradientSpan.Shape, through each shape's bounds. |
horizontal(colors, span) | Left to right. |
linear(angleDegrees, colors, span) | At an angle, clockwise from left to right. 45 runs from the top-left corner to the bottom-right corner whatever the bounds' shape. At other angles on non-square bounds, the end colors hold near the corners. |
fade(endAlpha, span) | Top to bottom, from each shape's color to that color at endAlpha. |
Custom Gradients
Build a ChartGradient.Linear directly for full control over stops and geometry. It takes
start and end points, a tileMode for beyond them, stops, and a span. Points are
GradientPoints, as fractions of the gradient's bounds: (0, 0) is the top-left corner and
(1, 1) the bottom-right. Stops are GradientStops with an offset from 0 at the start to
1 at the end.
val highlight = ChartGradient.Linear(
    stops = listOf(
        GradientStop.Series(offset = 0f, alpha = 1f),
        GradientStop.Fixed(offset = 0.6f, color = Color.White),
        GradientStop.Series(offset = 1f, alpha = 0.2f),
    ),
    start = GradientPoint(x = 0f, y = 0f),
    end = GradientPoint(x = 1f, y = 1f),
    span = GradientSpan.Shape,
    tileMode = TileMode.Clamp,
)
Colors
A stop is one of two kinds:
GradientStop.Fixed(offset, color)draws that color as given.GradientStop.Series(offset, alpha)draws the shape's own color atalpha, as set by the style that takes the gradient.
ChartGradients.fade() uses series colors, so each shape fades from its own color. Bars below
zero fade toward the baseline too.
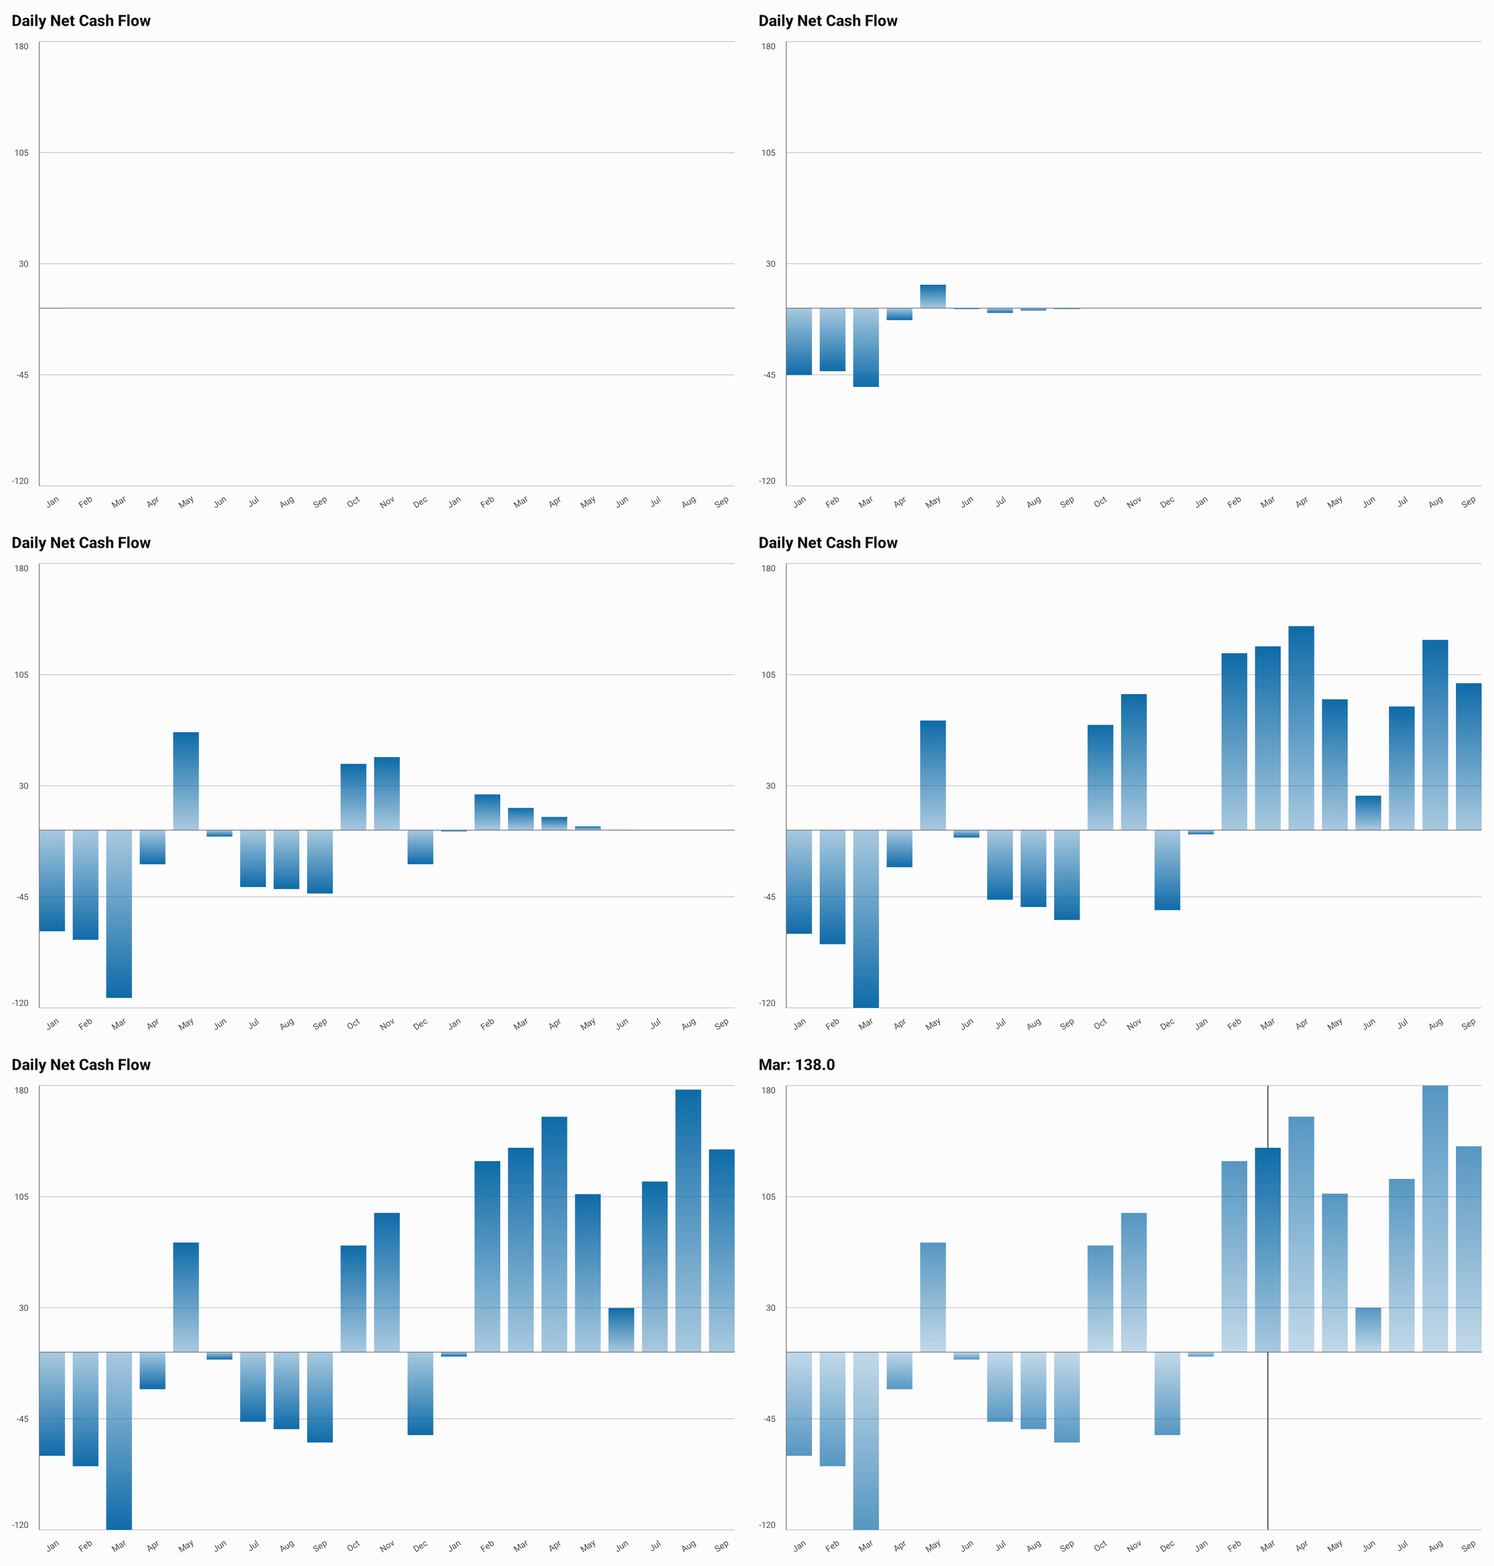
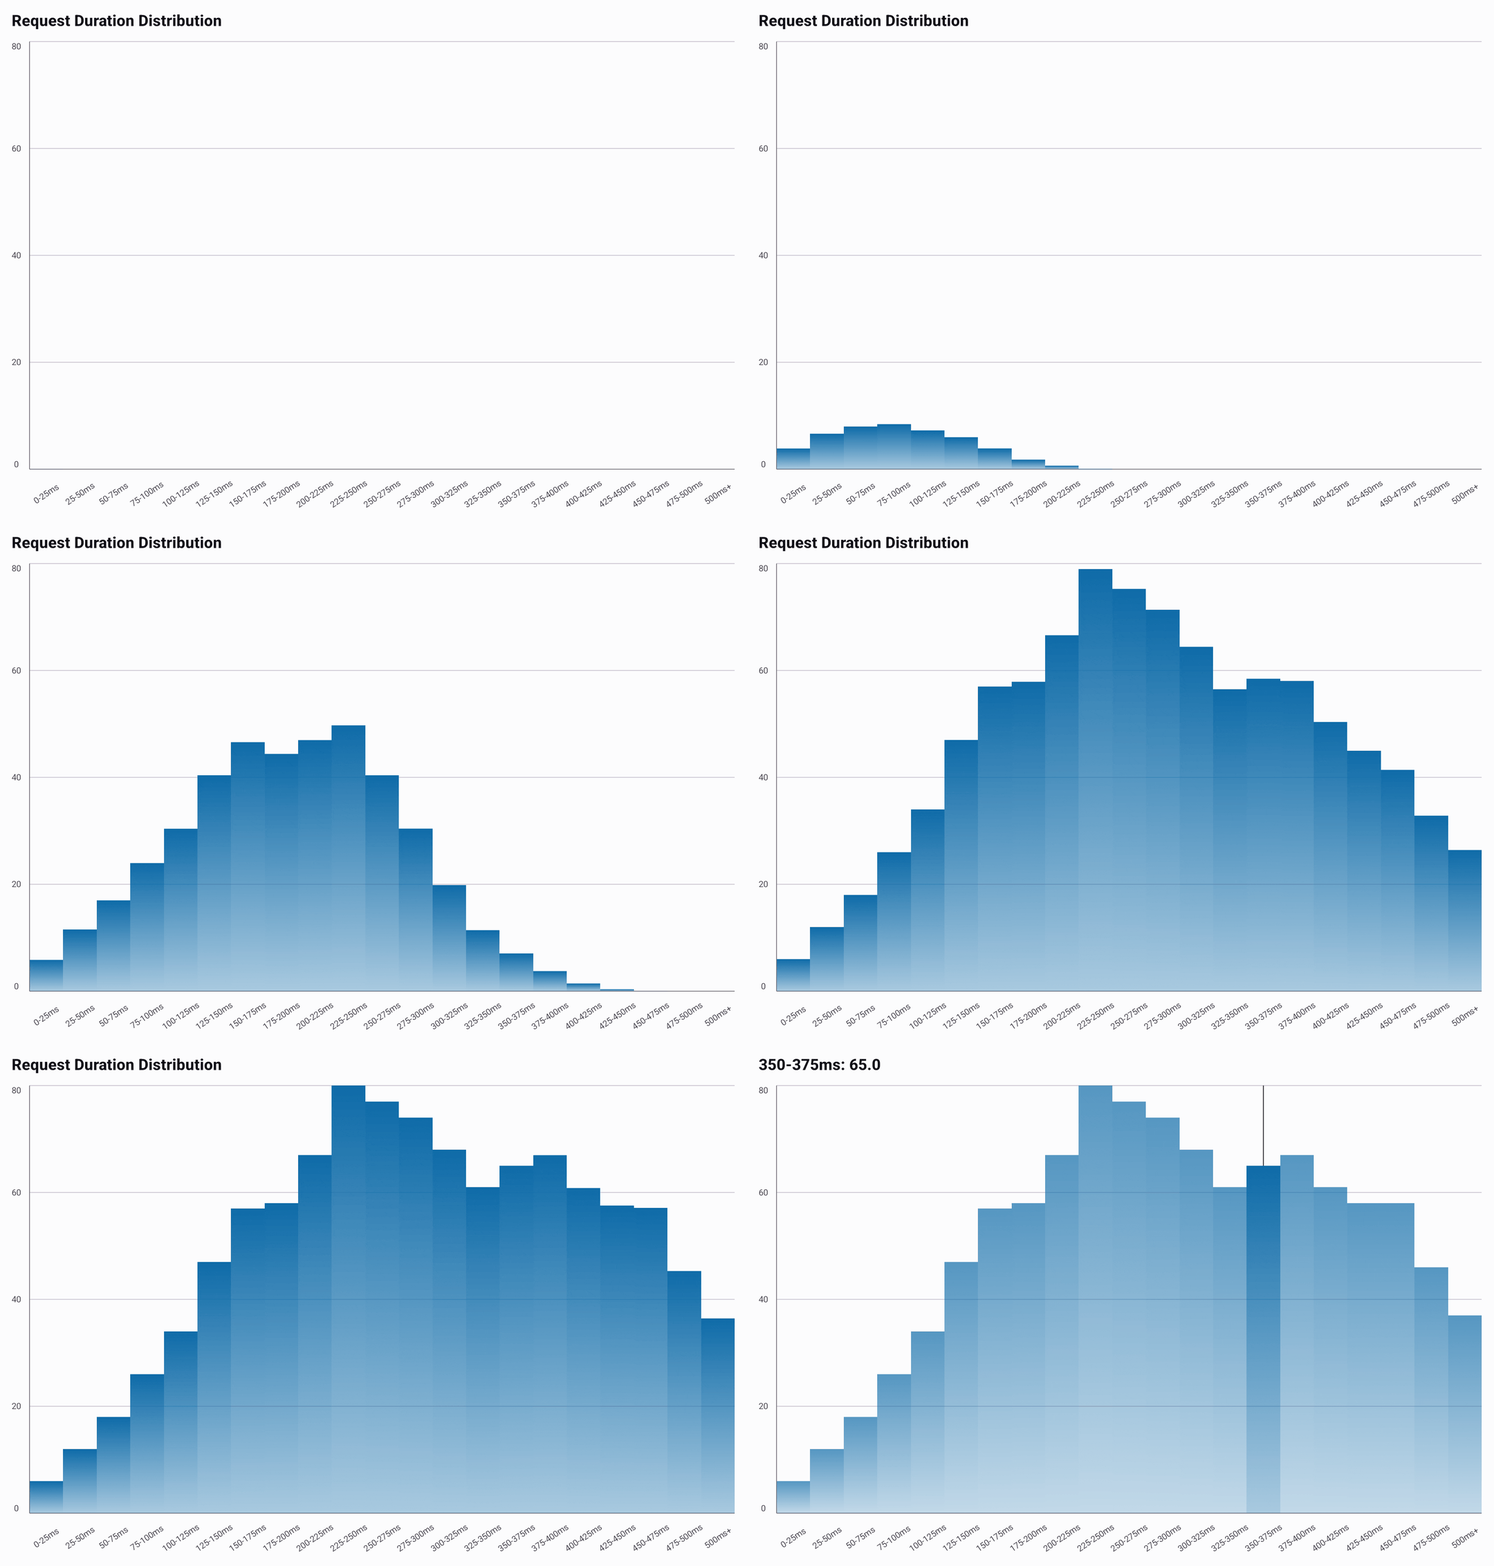
The GIFs above use the default bar color and longer generated series; their full source is in
BarGradientExample.kt and
HistogramGradientExample.kt.
val fade = ChartGradients.fade(endAlpha = 0.35f)
BarChartDefaults.bars(gradient = fade)
HistogramChartDefaults.bars(gradient = fade)
The color of bars() sets the color the fade starts from:
BarChartDefaults.bars(
    color = Color(0xFF22B59A),
    gradient = ChartGradients.fade(endAlpha = 0.15f),
)
Alpha and Selection
The alpha of the style that takes the gradient multiplies the whole gradient. Charts that dim
unselected shapes dim gradients the same way they dim solid colors.
Clamping
A gradient never replaces the chart with an error. The chart draws the closest gradient it can:
- An offset outside
0..1is clamped to that range, and stops out of order are sorted. Equal offsets make a hard edge between two colors. - A stop with a non-finite offset is dropped.
- A single stop paints its color solid.
- With no stops, non-finite positions, or the same start and end, shapes draw solid, without a gradient.
- A
GradientStop.Seriesalpha outside0..1is clamped to that range.