
Heatmap Chart
Overview
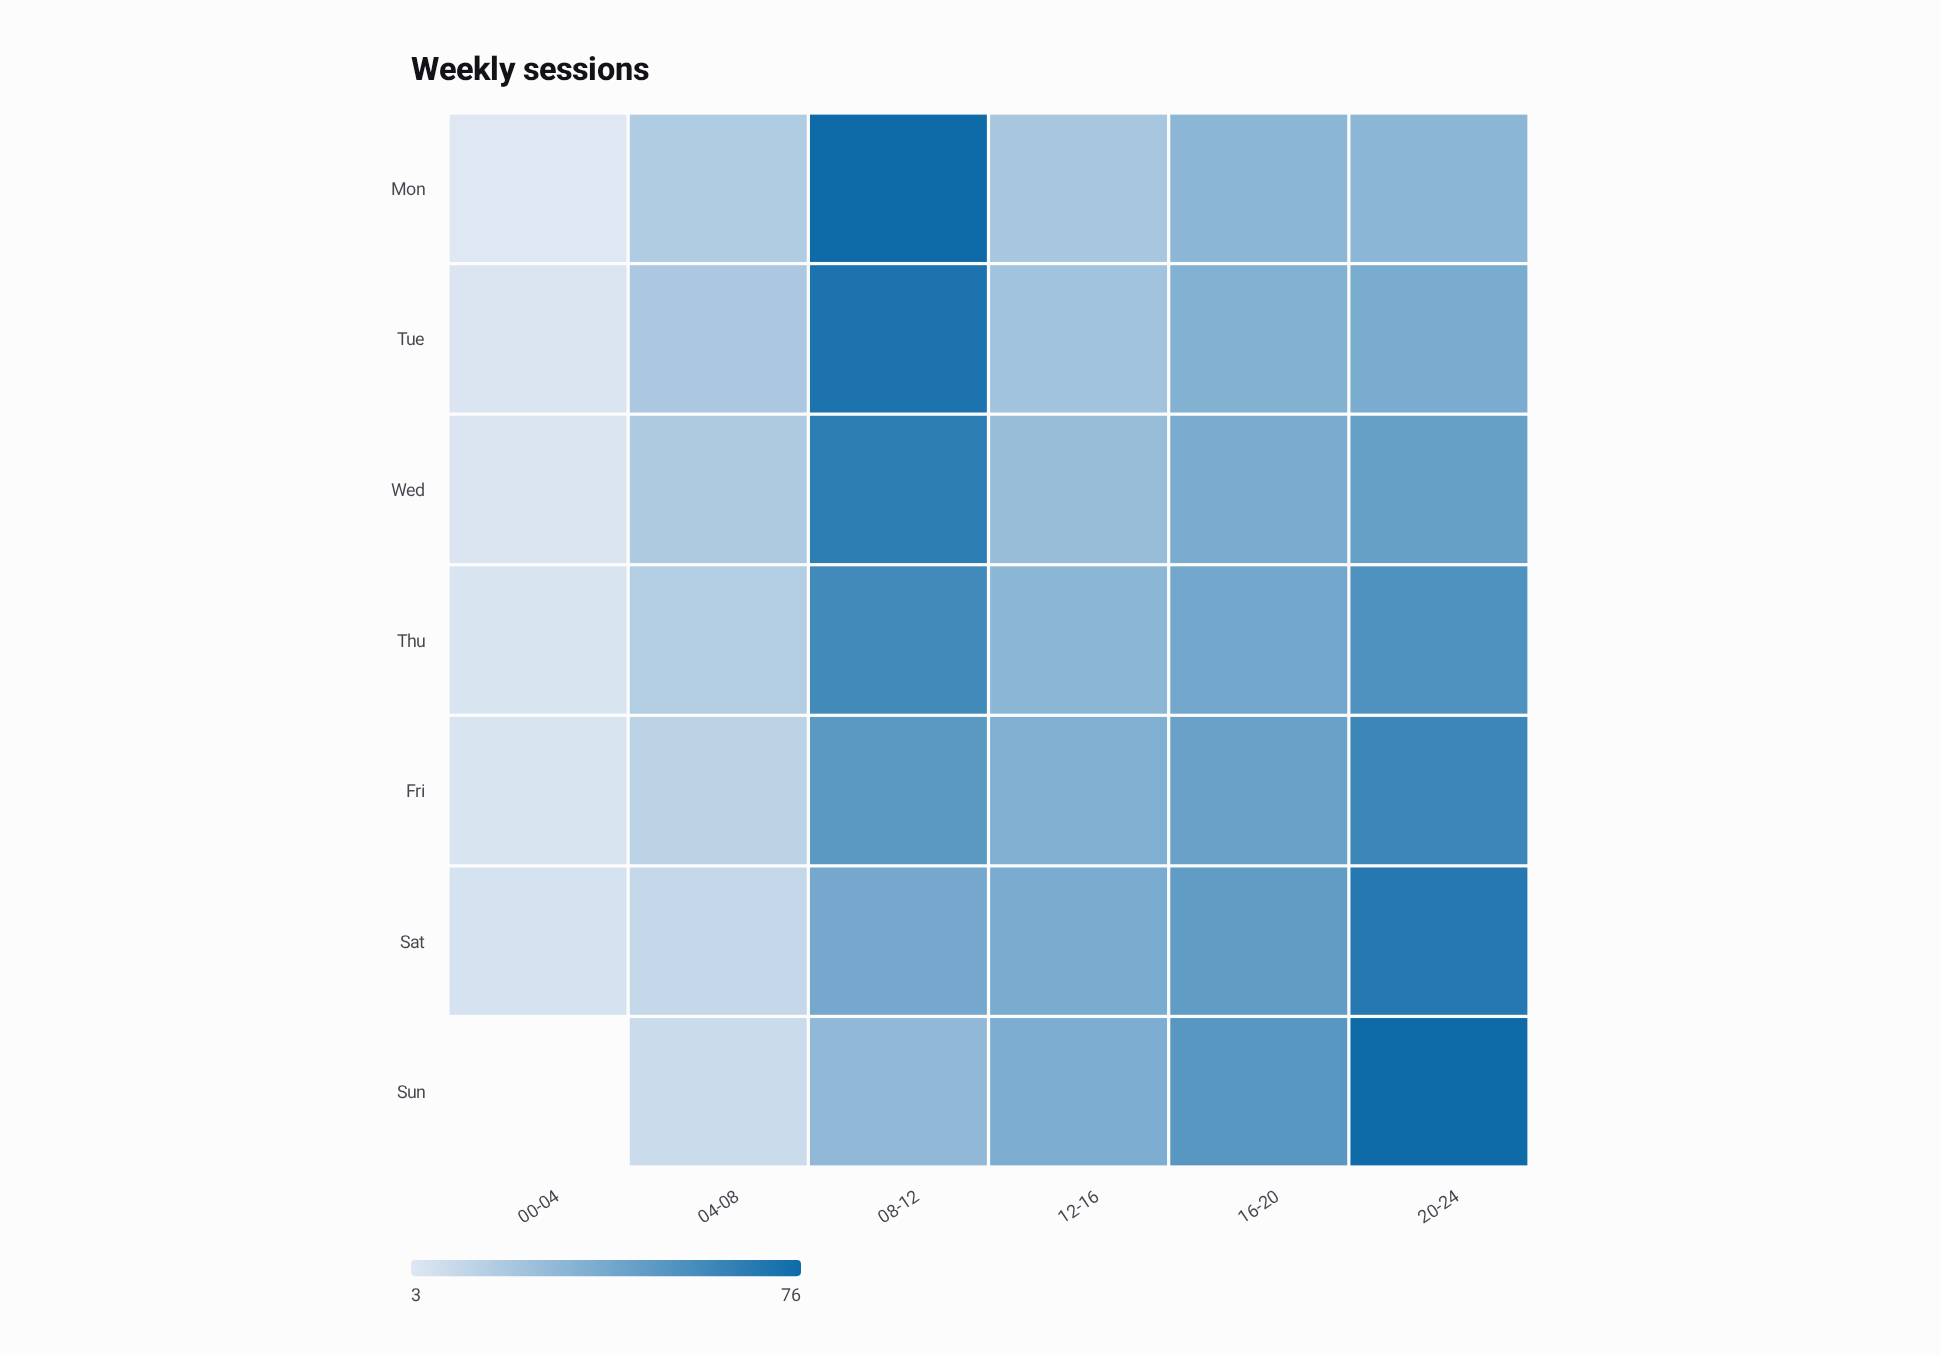
Heatmap charts color a grid of values on two category axes, such as sessions per weekday and hour, error rates per service and region, or temperature anomalies per city and month. Column labels run along the X axis and row labels along the Y axis. A color scale maps each value to a color, and a legend shows the scale with its values.
Draw the matrix as discrete cells, or as a smooth color field interpolated from the same values. Both modes share the data, color scale, legend and selection. The chart fits the whole matrix in its bounds; it does not scroll or zoom, and it thins row and column labels that would overlap.
Add the heatmap chart module to your dependencies:
implementation("io.github.hdcharts:heatmap:3.2.0-SNAPSHOT")Basic Usage
import androidx.compose.runtime.Composable
import androidx.compose.ui.Modifier
import io.github.hdcharts.heatmap.HeatmapChart
import io.github.hdcharts.heatmap.HeatmapData

val weeklySessions =
    HeatmapData(
        columns = listOf("00-04", "04-08", "08-12", "12-16", "16-20", "20-24"),
        rows = listOf("Mon", "Tue", "Wed", "Thu", "Fri", "Sat", "Sun"),
        values =
            listOf(
                listOf(3.0, 19.0, 76.0, 22.0, 32.0, 32.0),
                listOf(4.0, 21.0, 71.0, 24.0, 35.0, 38.0),
                listOf(4.0, 20.0, 65.0, 28.0, 38.0, 45.0),
                listOf(5.0, 18.0, 58.0, 32.0, 41.0, 53.0),
                listOf(5.0, 15.0, 49.0, 36.0, 44.0, 60.0),
                listOf(6.0, 12.0, 40.0, 38.0, 47.0, 68.0),
                // No data was collected during Sunday night maintenance, so that cell is missing.
                listOf(null, 10.0, 30.0, 37.0, 50.0, 76.0),
            ),
    )

@Composable
fun ShowWeeklySessions(modifier: Modifier = Modifier) {
    HeatmapChart(data = weeklySessions, modifier = modifier, title = "Weekly sessions")
}
Data Mapping
HeatmapData holds ordered columns, ordered rows, and a row-major values matrix:
values[row][column]. The matrix needs one value list per row label and one value per column label.
A null value is a missing cell: it draws empty, cannot be selected, and is never read as zero.
Application records usually arrive as one item per cell. Map them by looking each row and column up,
so combinations without a record stay null:
data class SessionCount(
    val day: String,
    val block: String,
    val sessions: Int,
)

fun sessionHeatmap(
    counts: List<SessionCount>,
    days: List<String>,
    blocks: List<String>,
): HeatmapData {
    val sessionsByCell = counts.associate { (it.day to it.block) to it.sessions.toDouble() }
    return HeatmapData(
        columns = blocks,
        rows = days,
        // A day and block with no record stays null, so it draws as a missing cell.
        values = days.map { day -> blocks.map { block -> sessionsByCell[day to block] } },
    )
}
Capabilities
Color Scale
A HeatmapColorScale takes two or more colors and spreads them evenly over its value domain. With
n colors, color i sits at min + (max - min) * i / (n - 1), and colors blend linearly between
neighboring stops. The legend labels the value at each stop.
Set min, max, or both to fix the domain, for example so a color means the same value in every
chart. Values beyond a bound use the end color. Without bounds, the domain spans the smallest and
largest present values; when every value is the same, every cell uses the middle color.
The default scale, from HeatmapChartDefaults.colorScale(), runs from a light tint of the theme's
primary color to the primary color, so it follows light and dark themes as Basic Usage shows. Pass
explicit colors when the values have a meaning of their own, such as safe and critical levels, or
when the chart must look the same in every theme.
Sequential Color Scale
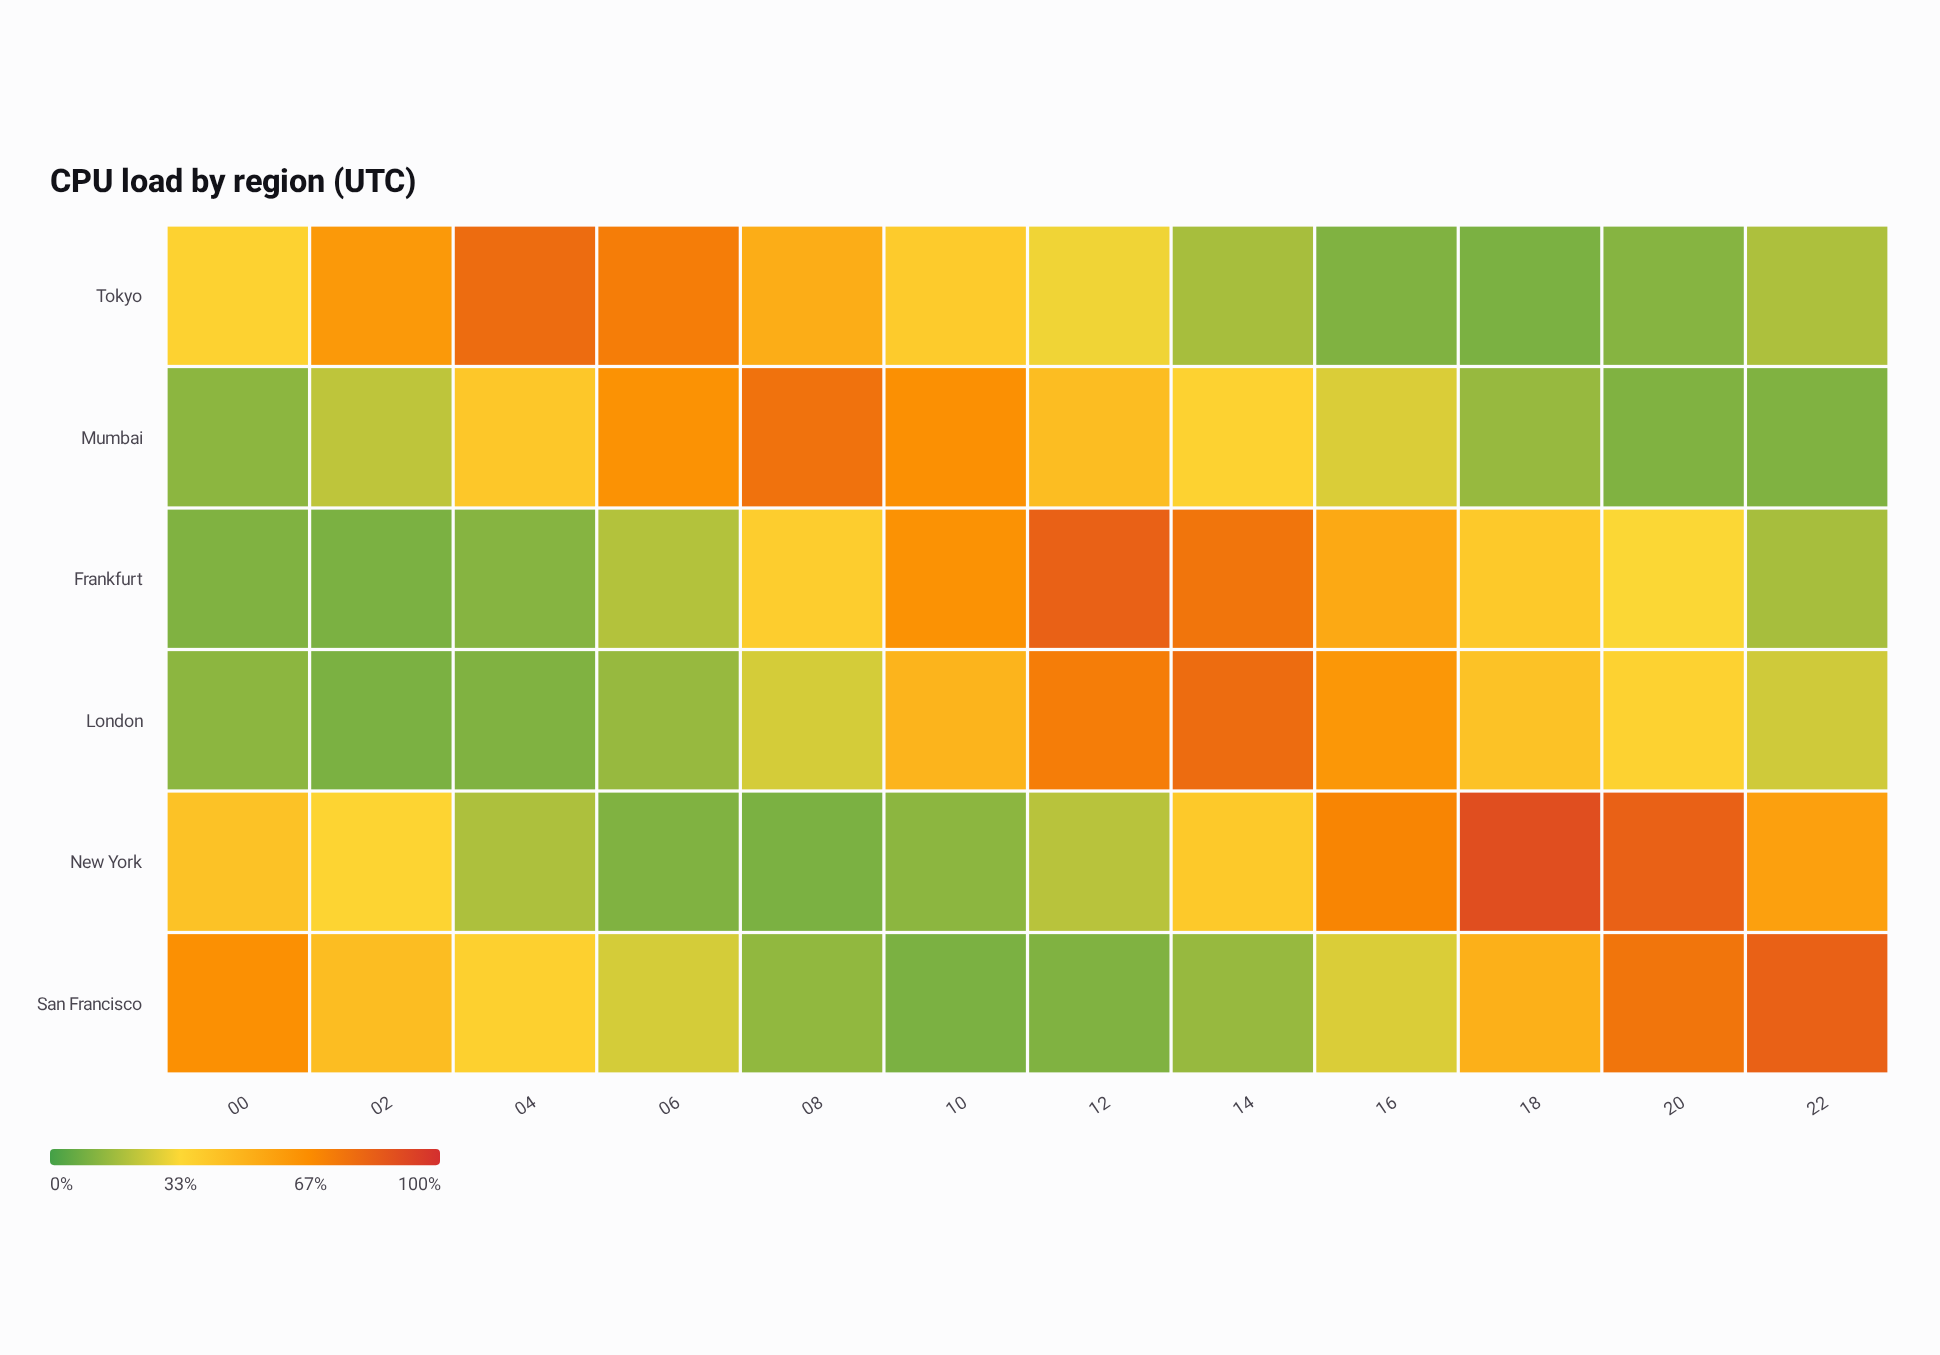
Use a sequential scale for a measure that runs from low to high, such as load, risk, or intensity. Several stops make differences easier to read than one hue. Here green, yellow, orange and red sit at 0, 33, 67 and 100 percent, and fixed bounds keep those meanings whatever the data range is:
// Average CPU load in percent per region, in two-hour UTC blocks.
val regionalCpuLoad =
    HeatmapData(
        columns = listOf("00", "02", "04", "06", "08", "10", "12", "14", "16", "18", "20", "22"),
        rows = listOf("Tokyo", "Mumbai", "Frankfurt", "London", "New York", "San Francisco"),
        values =
            listOf(
                listOf(36.0, 61.0, 78.0, 72.0, 52.0, 39.0, 31.0, 18.0, 11.0, 10.0, 12.0, 19.0),
                listOf(13.0, 22.0, 41.0, 64.0, 76.0, 65.0, 45.0, 36.0, 27.0, 15.0, 11.0, 11.0),
                listOf(11.0, 10.0, 12.0, 20.0, 38.0, 64.0, 82.0, 75.0, 54.0, 40.0, 33.0, 18.0),
                listOf(13.0, 10.0, 11.0, 15.0, 26.0, 49.0, 72.0, 78.0, 62.0, 43.0, 36.0, 25.0),
                listOf(43.0, 35.0, 19.0, 11.0, 10.0, 13.0, 21.0, 40.0, 69.0, 89.0, 82.0, 58.0),
                listOf(65.0, 45.0, 37.0, 26.0, 14.0, 10.0, 11.0, 15.0, 27.0, 51.0, 75.0, 82.0),
            ),
    )

// Fixed 0..100 bounds: green, yellow, orange and red sit at 0, 33, 67 and 100 percent.
val cpuLoadScale =
    HeatmapColorScale(
        colors = listOf(Color(0xFF43A047), Color(0xFFFDD835), Color(0xFFFB8C00), Color(0xFFD32F2F)),
        min = 0.0,
        max = 100.0,
    )

@Composable
fun ShowRegionalCpuLoad(modifier: Modifier = Modifier) {
    HeatmapChart(
        data = regionalCpuLoad,
        modifier = modifier,
        title = "CPU load by region (UTC)",
        style = HeatmapChartDefaults.style(colorScale = cpuLoadScale),
        valueFormatter = { load -> "${load.roundToInt()}%" },
    )
}
Diverging Color Scale
Use a diverging scale for values above and below a meaningful midpoint, such as deviations from an
average. Give it an odd number of colors with a neutral middle color, and set symmetric bounds so the
midpoint falls on that color. Here zero is the middle of -4.0..4.0:
@Composable
fun ShowTemperatureAnomalies(modifier: Modifier = Modifier) {
    val anomalies =
        HeatmapData(
            columns = listOf("Jan", "Feb", "Mar", "Apr", "May", "Jun"),
            rows = listOf("Oslo", "Berlin", "Madrid"),
            values =
                listOf(
                    listOf(-2.4, -1.1, 0.6, 1.3, 0.2, -0.4),
                    listOf(-1.2, -0.4, 0.8, 1.6, 1.1, 2.0),
                    listOf(0.3, 0.9, 1.4, 2.2, 2.9, 3.4),
                ),
        )
    HeatmapChart(
        data = anomalies,
        modifier = modifier,
        title = "Temperature anomaly (°C)",
        style =
            HeatmapChartDefaults.style(
                // Symmetric bounds keep zero on the middle color.
                colorScale =
                    HeatmapChartDefaults.colorScale(
                        colors = listOf(Color(0xFF2166AC), Color(0xFFF7F7F7), Color(0xFFB2182B)),
                        min = -4.0,
                        max = 4.0,
                    ),
                cellSpacing = 4.dp,
            ),
    )
}
Cells and Interpolated Rendering
HeatmapRenderMode.Cells, the default, draws one flat rectangle per cell. cellSpacing sets the gap
between cells. HeatmapRenderMode.Interpolated draws a continuous color field computed from the
same values, on the same color scale.
Use Cells when each value is an independent observation, such as categories, services, or weekdays,
where the space between two rows or columns has no meaning. Use Interpolated when neighboring rows
and columns are continuous, such as consecutive hours or nearby regions, and the trend between them
is worth showing. The colors between cell centers are estimates computed from the neighboring values,
not additional observations; selection and the legend marker always report a cell's own value.
This example reuses regionalCpuLoad and cpuLoadScale from Sequential Color Scale, so the two
images differ only in the render mode:
@Composable
fun ShowInterpolatedCpuLoad(
    data: HeatmapData,
    modifier: Modifier = Modifier,
) {
    HeatmapChart(
        data = data,
        modifier = modifier,
        title = "CPU load by region (UTC)",
        style =
            HeatmapChartDefaults.style(
                renderMode = HeatmapRenderMode.Interpolated,
                colorScale = cpuLoadScale,
            ),
        valueFormatter = { load -> "${load.roundToInt()}%" },
    )
}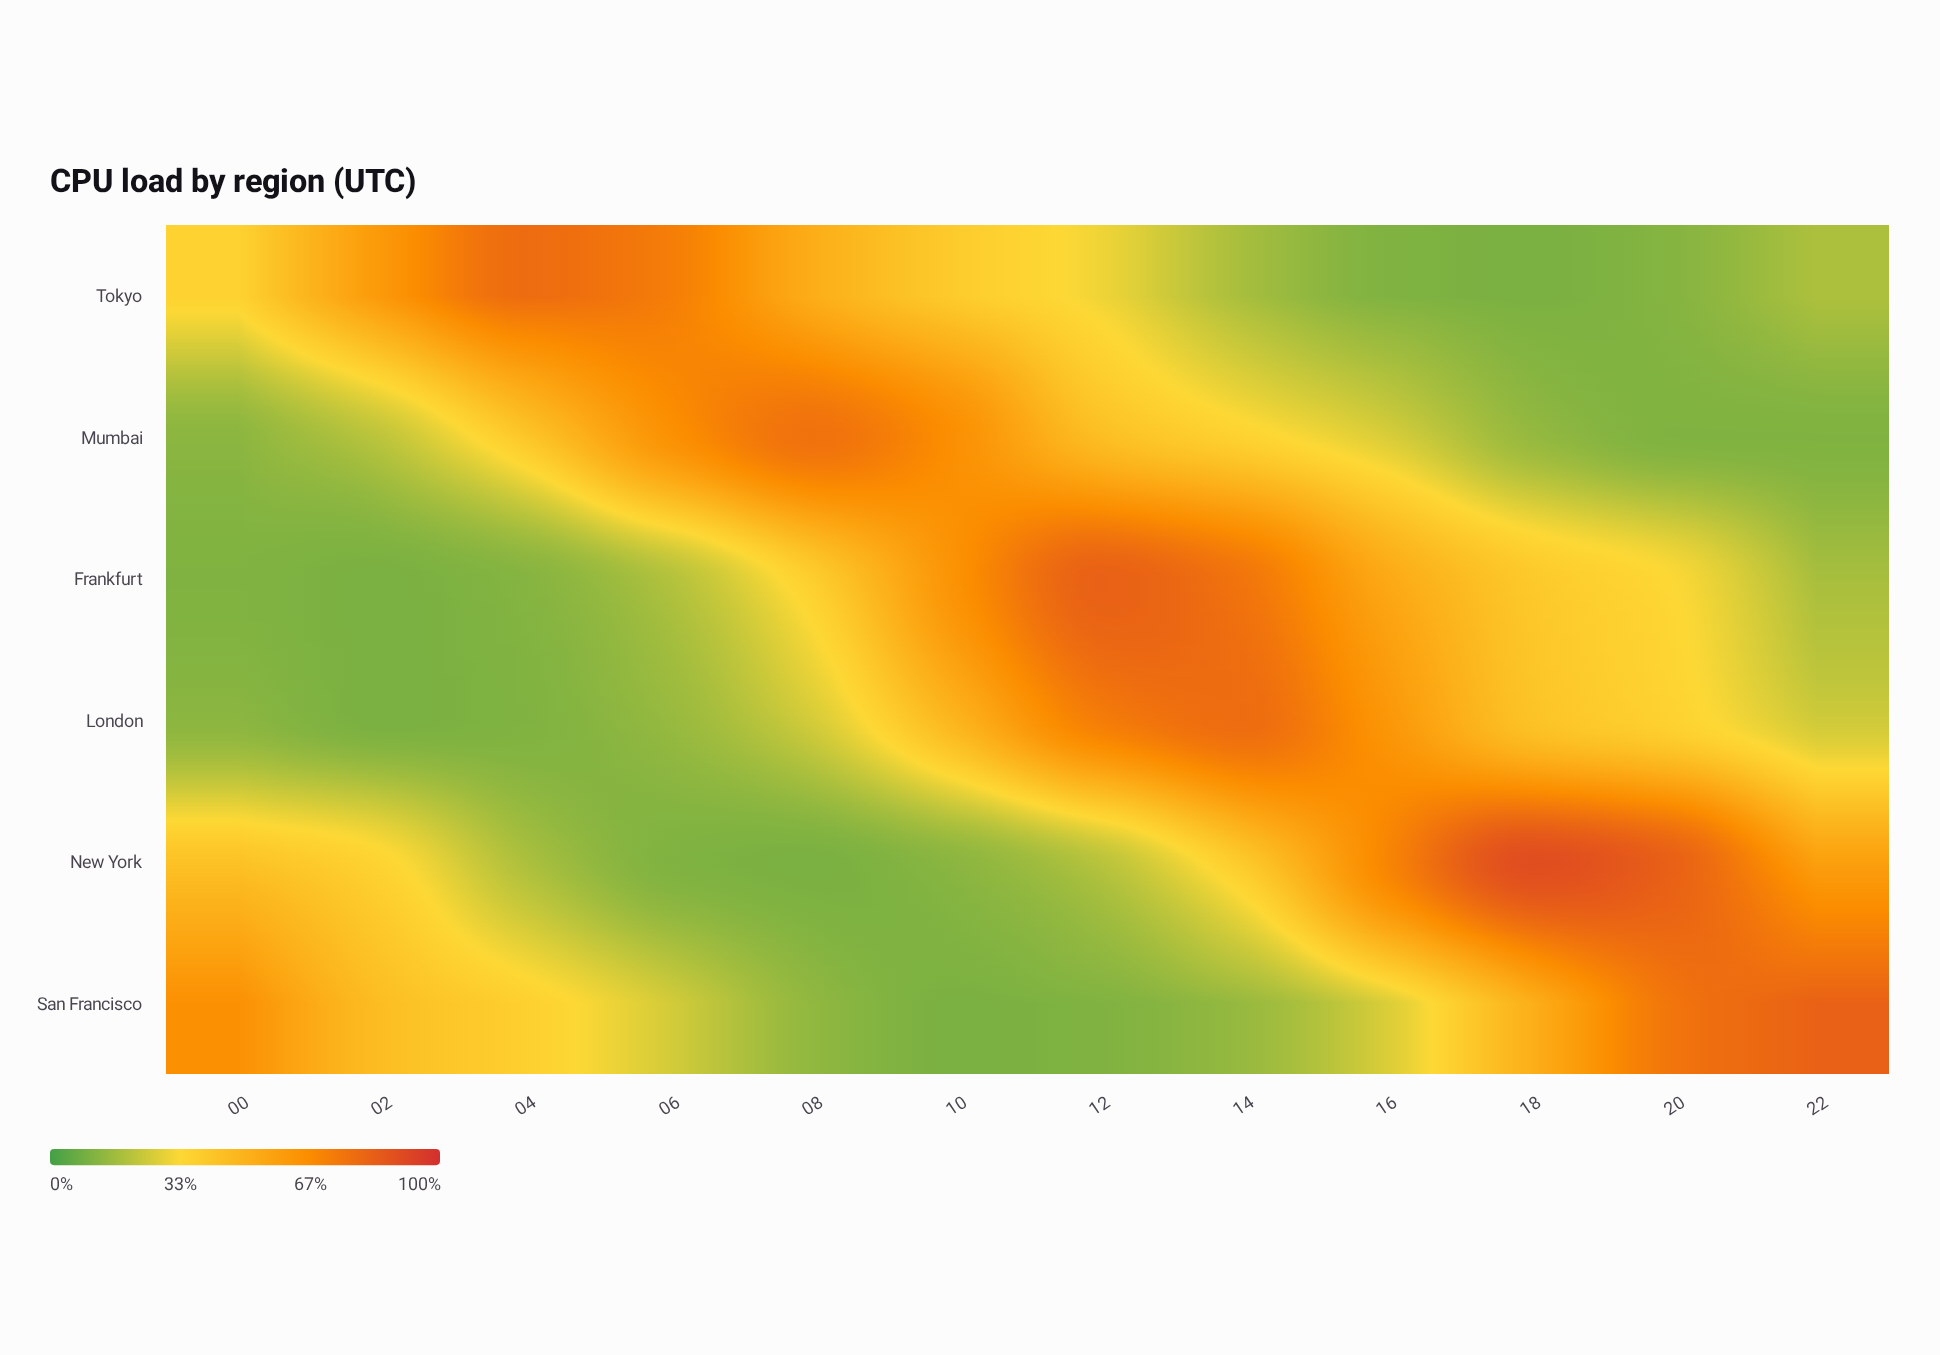
The field is calculated from your values, not painted as a decorative gradient:
- Each value sits at the center of its cell, and the field equals that value there. Between four neighboring centers the field is a smooth, shape-preserving bicubic interpolation, then mapped through the same color scale as the cells. It bends smoothly at cell centers, never leaves the range of the four surrounding values, and adds no peak or valley the data does not have; a straight run of values stays a straight ramp.
- Beyond the outermost centers, the field keeps the edge values.
- A single row or column interpolates along its only axis, and a single cell draws one color.
- Next to a missing cell, only the neighbors that have values are blended, with their weights rescaled to sum to one. The field never blends toward a value that does not exist and stays smooth up to the gap. Missing cells draw empty in both modes, with edges on the cell boundary.
Legend
The legend below the plot draws the color scale as a bar, with the value at each color stop. Its ends
show the lowest and highest values of the scale. When a cell is selected, a marker shows where its
value sits on the scale. valueFormatter formats the legend values and the selected value. Hide the
legend with legend = LegendDefaults.style(visible = false).
Selection
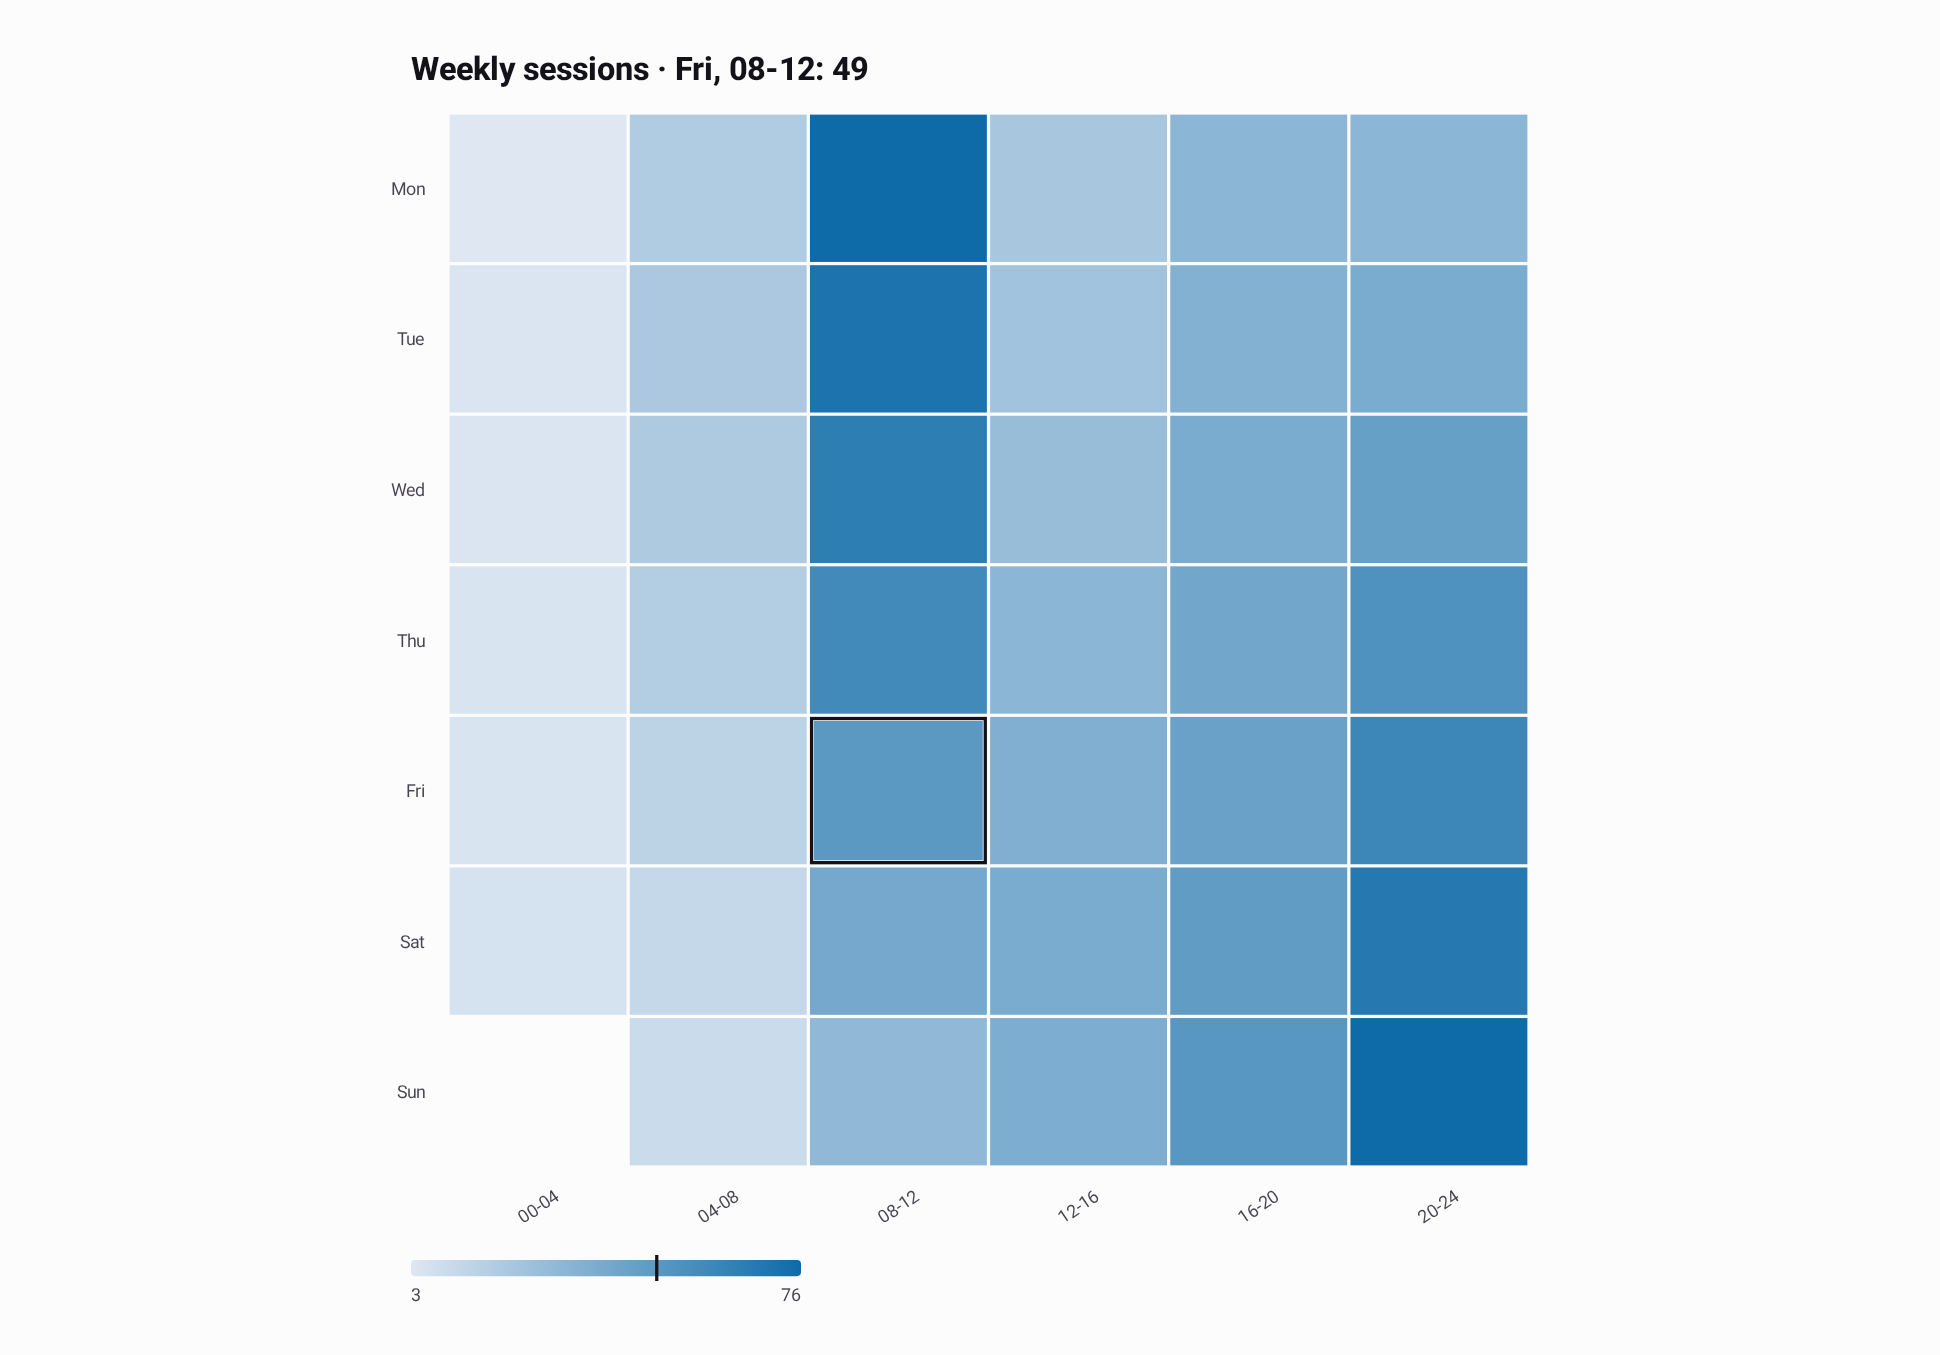
Tapping or dragging over a cell selects it, and the heading shows its row, column and value. Tapping a missing cell clears the selection. In interpolated mode, the selection still covers one source cell and reports that cell's own value, never an interpolated one.
Pass a ChartSelection to select a cell from code. Its index counts cells row by row:
row * columns.size + column, which HeatmapData.cellIndex computes. A selection of a missing cell
or an index outside the matrix is cleared, and changing the data clears the selection. Set
interactionEnabled = false to turn off gestures while keeping programmatic selection visible. This
example reuses weeklySessions from Basic Usage:
@Composable
fun SelectSessionBlock(
    data: HeatmapData,
    modifier: Modifier = Modifier,
) {
    // Friday 08-12 is row 4, column 2.
    val selection = rememberChartSelection(initialIndex = data.cellIndex(row = 4, column = 2))

    HeatmapChart(
        data = data,
        modifier = modifier,
        title = "Weekly sessions",
        selection = selection,
    )
}
Validation
The chart shows an error instead of drawing when:
- There are no columns or no rows.
valuesdoes not have one list per row, or a list does not have one value per column.- A value is not finite, or no cell has a value.
- The color scale has fewer than two colors, a bound is not finite, or
minis not belowmax. - An axis label size or label count is invalid.
A negative cellSpacing draws as no spacing, and spacing wider than a cell still leaves each cell at
least one pixel wide.