
Stacked Area Chart
Overview
StackedAreaChart shows how multiple nonnegative series change across ordered categories and how
their totals accumulate. Supply each series' raw value at each category; the chart stacks those
values for display. Series must have matching lengths and share the same category order.
implementation("io.github.hdcharts:stacked-area:3.1.0")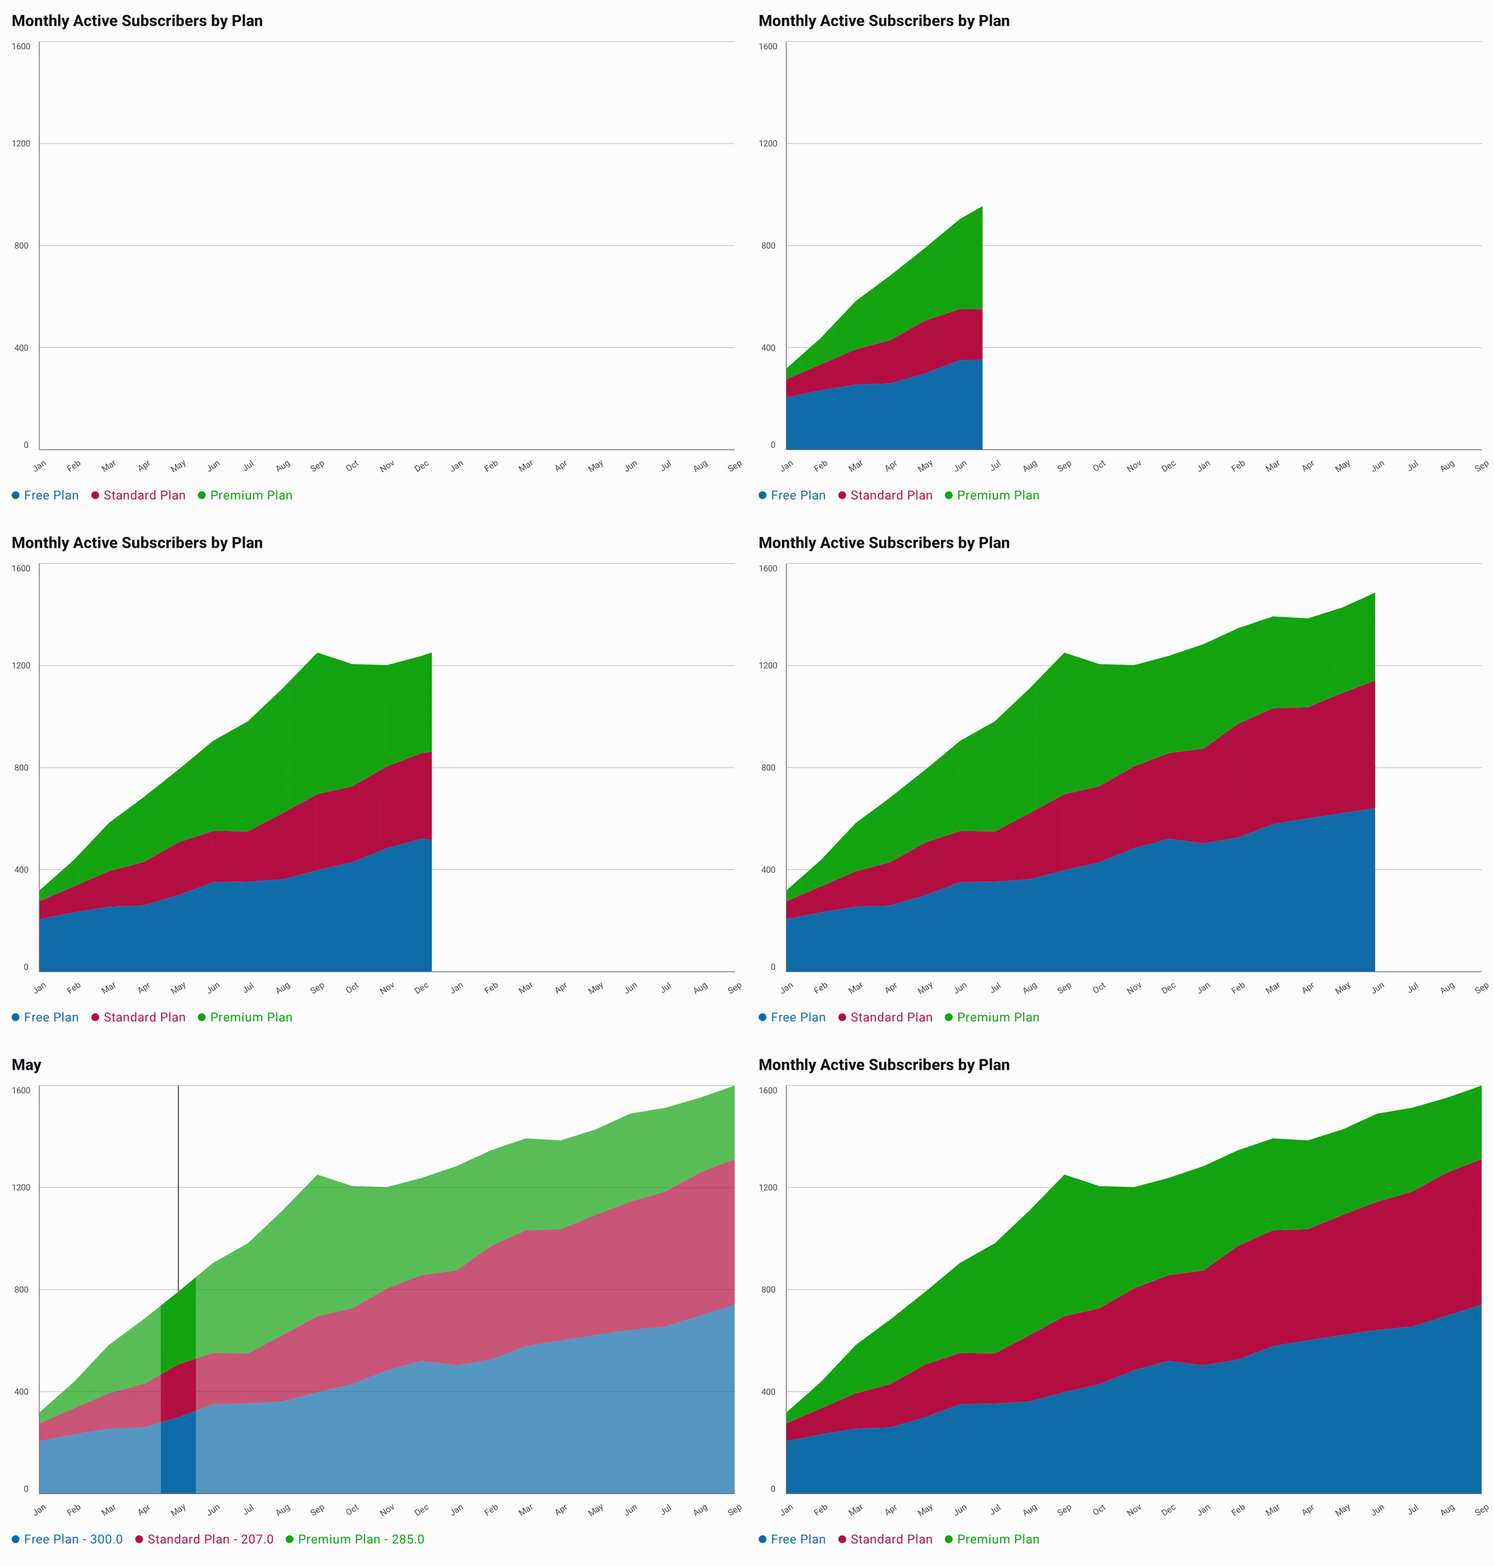
Recording source: StackedAreaExample.kt.
Basic Usage
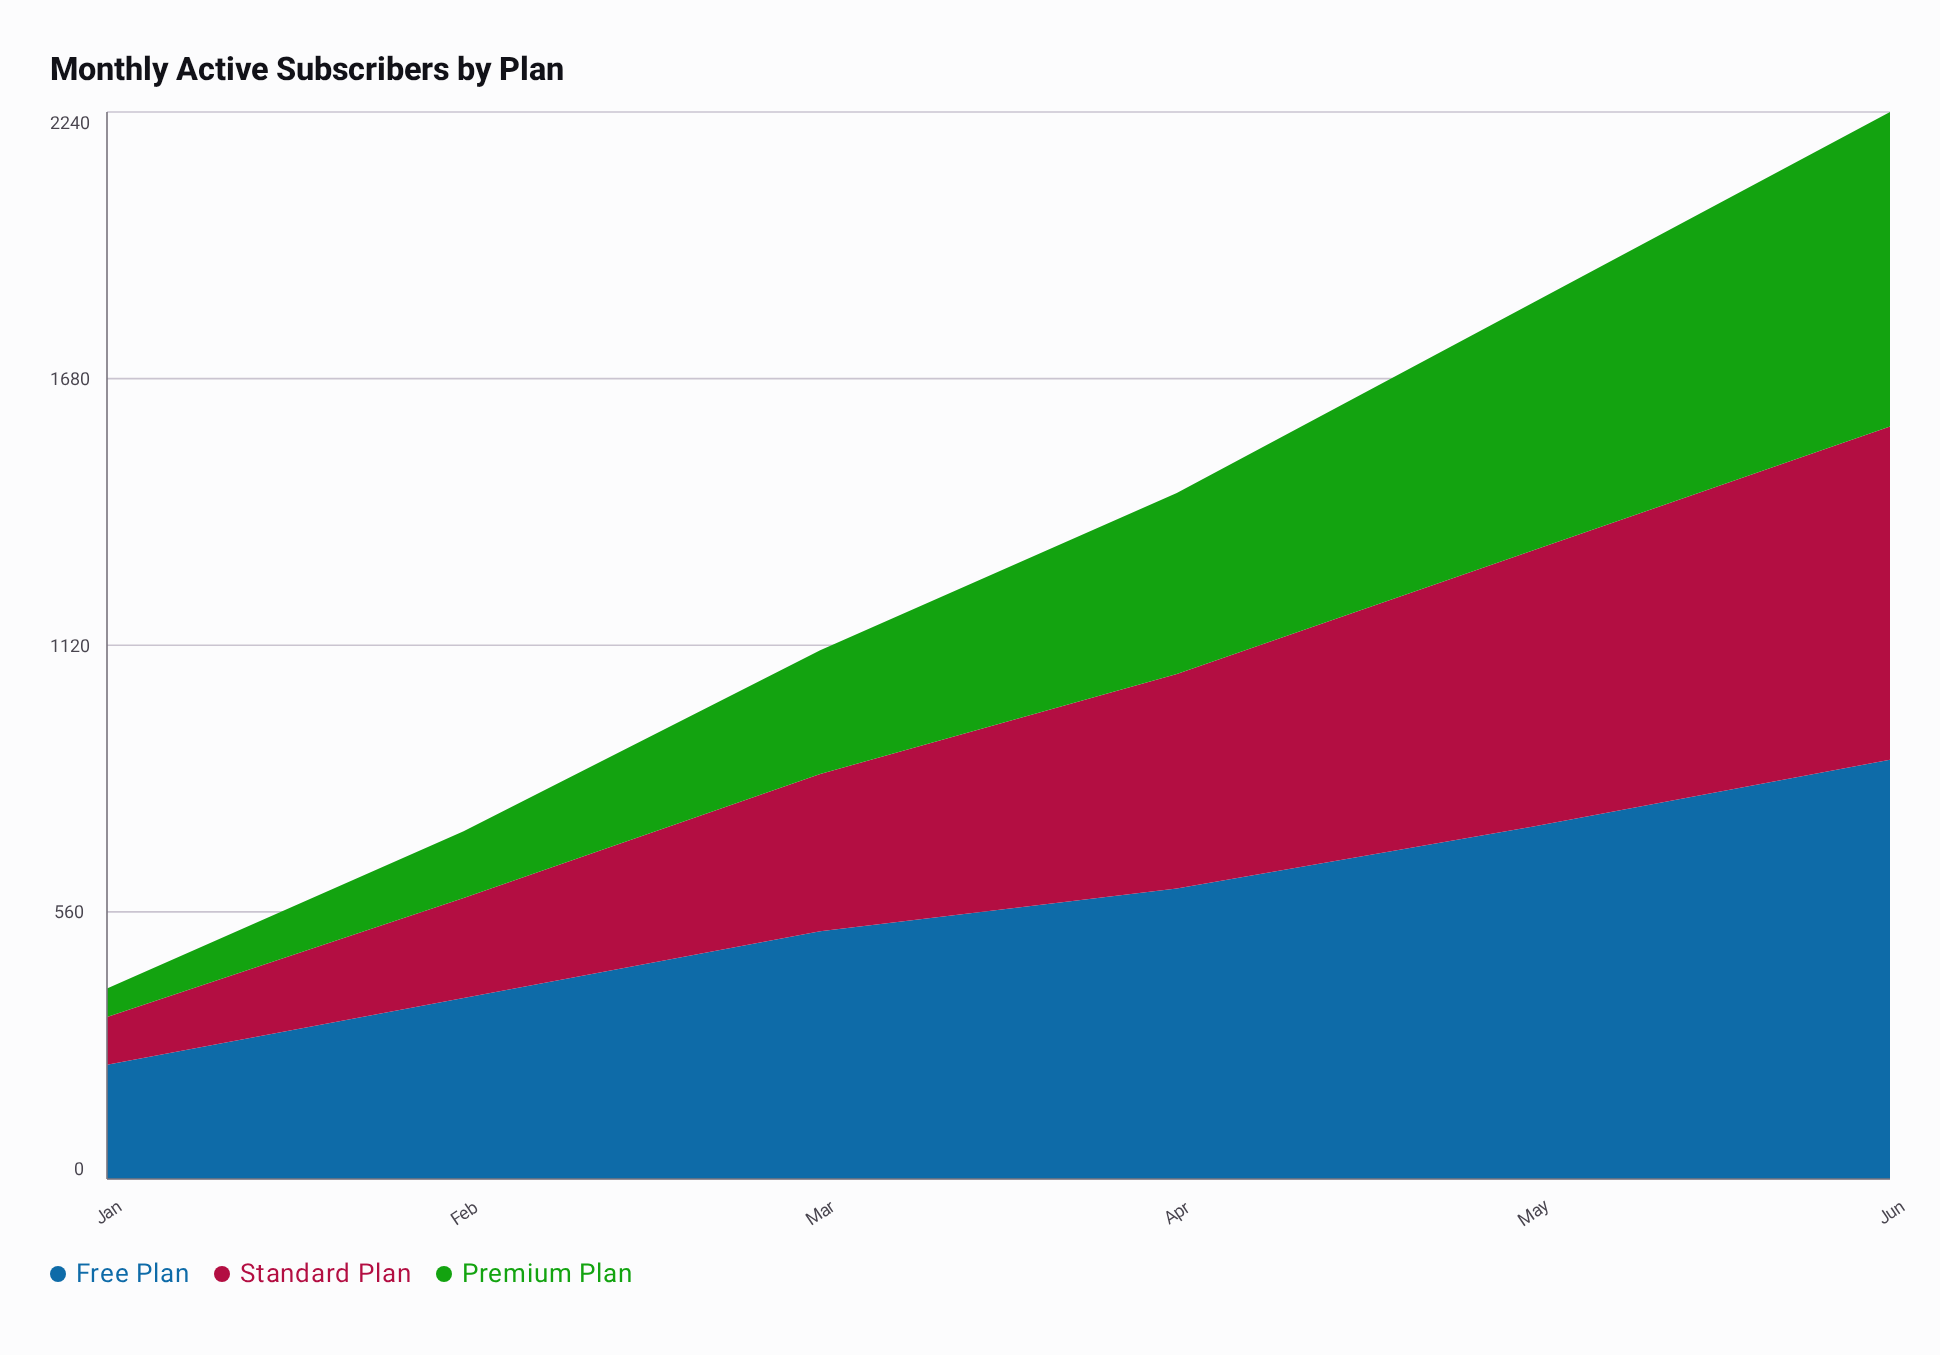
Each subscription plan contributes its own monthly active subscriber count. These inputs are not pre-accumulated totals: the chart builds the stacked boundaries from the per-plan values.
import androidx.compose.runtime.Composable
import androidx.compose.ui.Modifier
import io.github.hdcharts.core.model.toChartData
import io.github.hdcharts.stackedarea.StackedAreaChart

@Composable
fun ShowMonthlySubscribers(modifier: Modifier = Modifier) {
    val data =
        listOf(
            "Free Plan" to listOf(240.0, 380.0, 520.0, 610.0, 740.0, 880.0),
            "Standard Plan" to listOf(100.0, 210.0, 330.0, 450.0, 580.0, 700.0),
            "Premium Plan" to listOf(60.0, 140.0, 260.0, 380.0, 520.0, 660.0),
        ).toChartData(categories = listOf("Jan", "Feb", "Mar", "Apr", "May", "Jun"))

    StackedAreaChart(
        data = data,
        modifier = modifier,
        title = "Monthly Active Subscribers by Plan",
    )
}
Capabilities
Value Formatting
When a category is selected, selectedValueFormatter formats each plan's input value in the
legend. It does not format the cumulative boundary as a plan value. axisValueFormatter formats
the Y-axis ticks, which reflect the cumulative stack. This excerpt reuses data from Basic Usage.
@Composable
fun FormattedMonthlySubscribers(data: ChartData) {
    StackedAreaChart(
        data = data,
        selectedValueFormatter = ChartValueFormatters.suffix(" subscribers"),
        axisValueFormatter = ChartValueFormatters.suffix(" total subscribers"),
    )
}
Fade Gradient
The vertical fade follows each plan's series color, so the fill stays associated with its legend
entry. This excerpt reuses data from Basic Usage. See the shared
Gradients guide for gradient spans and custom stops.
@Composable
fun FadedMonthlySubscribers(data: ChartData) {
    StackedAreaChart(
        data = data,
        style =
            StackedAreaChartDefaults.style(
                fill =
                    StackedAreaChartDefaults.fill(
                        gradient = ChartGradients.fade(endAlpha = 0.35f),
                    ),
            ),
    )
}