
Gradients
Gradients color chart shapes along a line between stops. Supported styles accept a ChartGradient:
bar, histogram, stacked bar, stacked area, and line. Other chart families use solid colors.
| Chart | Style factory | Guide |
|---|---|---|
| Bar | BarChartDefaults.bars(gradient = ...) | Bar chart |
| Histogram | HistogramChartDefaults.bars(gradient = ...) | Histogram chart |
| Stacked bar | StackedBarChartDefaults.segments(gradient = ...) | Stacked bar chart |
| Stacked area | StackedAreaChartDefaults.fill(gradient = ...) | Stacked area chart |
| Line | LineChartDefaults.line(gradient = ...) | Line chart |
Span and Direction
GradientSpan.Shape uses each shape's bounds, so every shape shows the full gradient. GradientSpan.Plot
uses the plot bounds, so a shape shows only the part that crosses it. For bars below zero, a shape-spanning
vertical gradient mirrors at the baseline: it still runs from the value edge toward zero.
The following compiled example uses the same vertical gradient and colors for both charts. Only the span changes; the negative values also show how a shape-spanning gradient mirrors at zero.
import androidx.compose.foundation.layout.Column
import androidx.compose.runtime.Composable
import androidx.compose.ui.graphics.Color
import io.github.hdcharts.bar.BarChart
import io.github.hdcharts.core.model.toChartData
import io.github.hdcharts.core.style.BarChartDefaults
import io.github.hdcharts.core.style.ChartGradients
import io.github.hdcharts.core.style.GradientSpan

@Composable
fun CompareShapeAndPlotGradients() {
    val data =
        listOf(45.0, -12.0, 38.0, 27.0, -19.0).toChartData(
            categories = listOf("Mon", "Tue", "Wed", "Thu", "Fri"),
            seriesName = "Net cash flow",
        )
    val colors = listOf(Color(0xFF1E89E6), Color(0xFF9B4EDD), Color(0xFFEA7A2E))
    val shapeGradient = ChartGradients.vertical(colors = colors, span = GradientSpan.Shape)
    val plotGradient = ChartGradients.vertical(colors = colors, span = GradientSpan.Plot)

    Column {
        BarChart(
            data = data,
            title = "Every bar repeats the gradient",
            style =
                BarChartDefaults.style(
                    bars = BarChartDefaults.bars(gradient = shapeGradient),
                ),
        )
        BarChart(
            data = data,
            title = "One gradient spans the plot",
            style =
                BarChartDefaults.style(
                    bars =
                        BarChartDefaults.bars(
                            gradient = plotGradient,
                        ),
                ),
        )
    }
}
The bar guide's gradient example shows a basic chart setup.
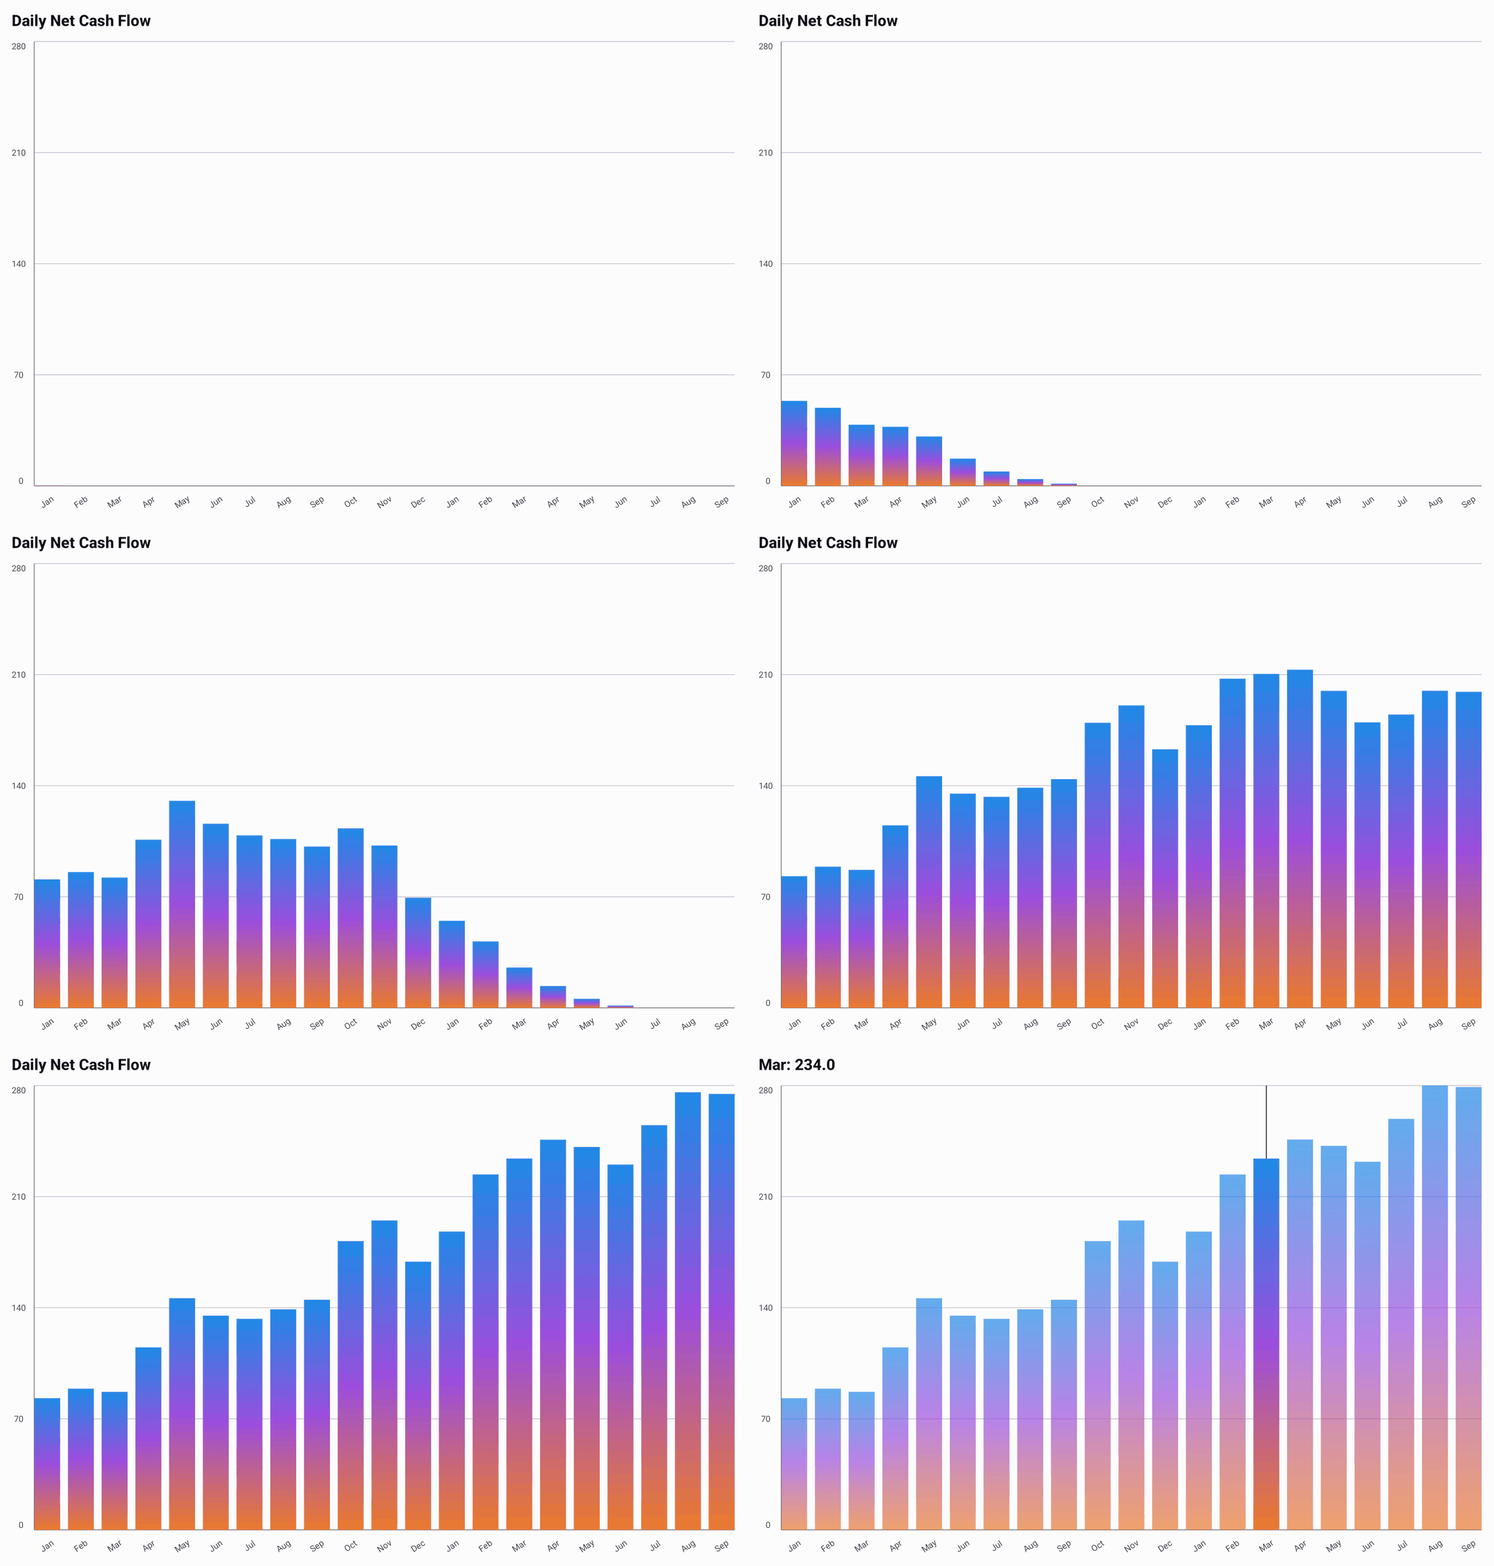
Bar — Shape. The recording uses blue-purple-orange stops with ChartGradients.vertical(colors = colors, span = GradientSpan.Shape), passed through BarChartDefaults.bars(gradient = ...) in BarChartDefaults.style(...). Each bar shows the full gradient; negative bars mirror it from the value edge toward zero.
Recording source: BarGradientExample.kt.
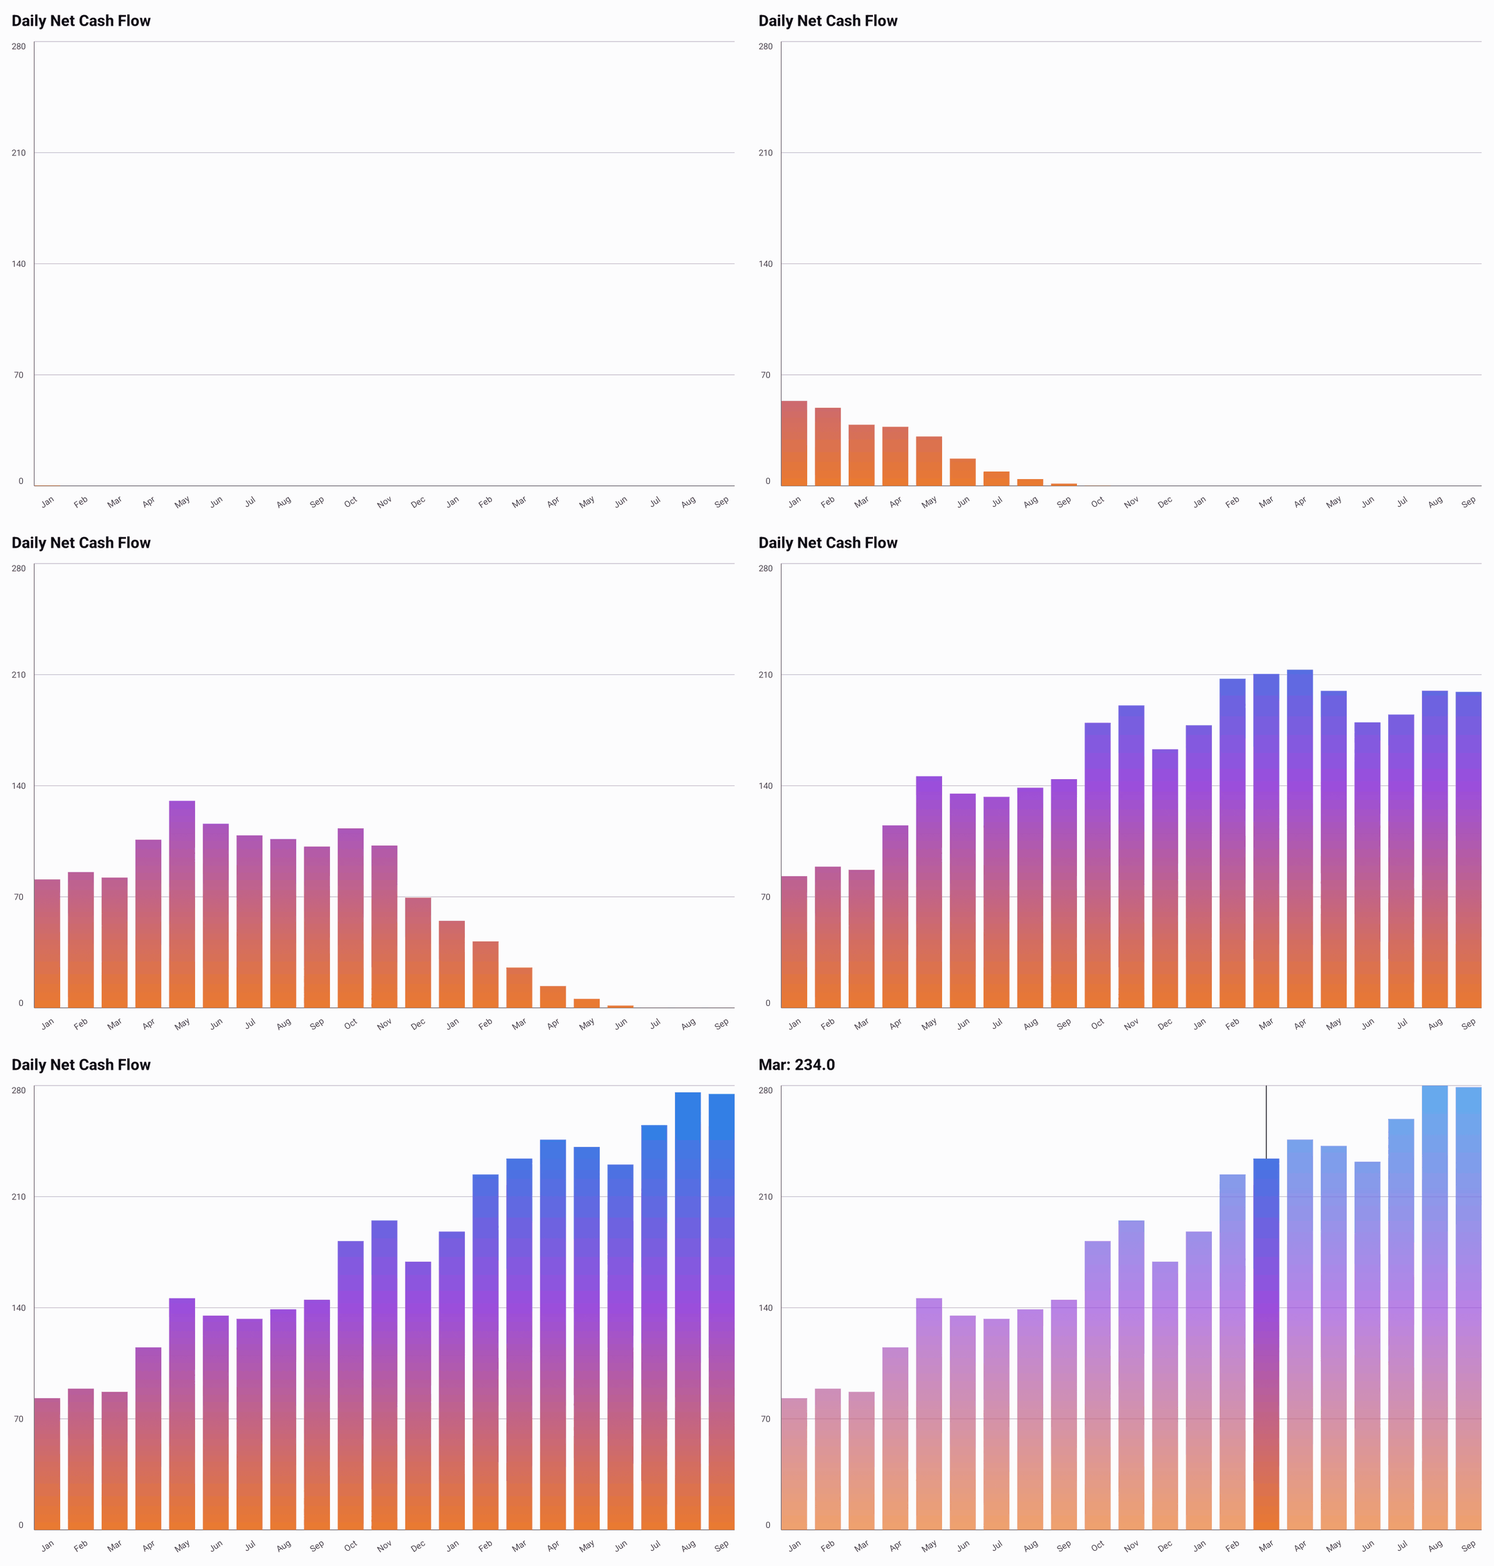
Bar — Plot. The same stops use ChartGradients.vertical(colors = colors, span = GradientSpan.Plot) with BarChartDefaults.bars(gradient = ...) in BarChartDefaults.style(...). The gradient spans the plot, so each bar shows the color at its height.
Recording source: BarGradientExample.kt.
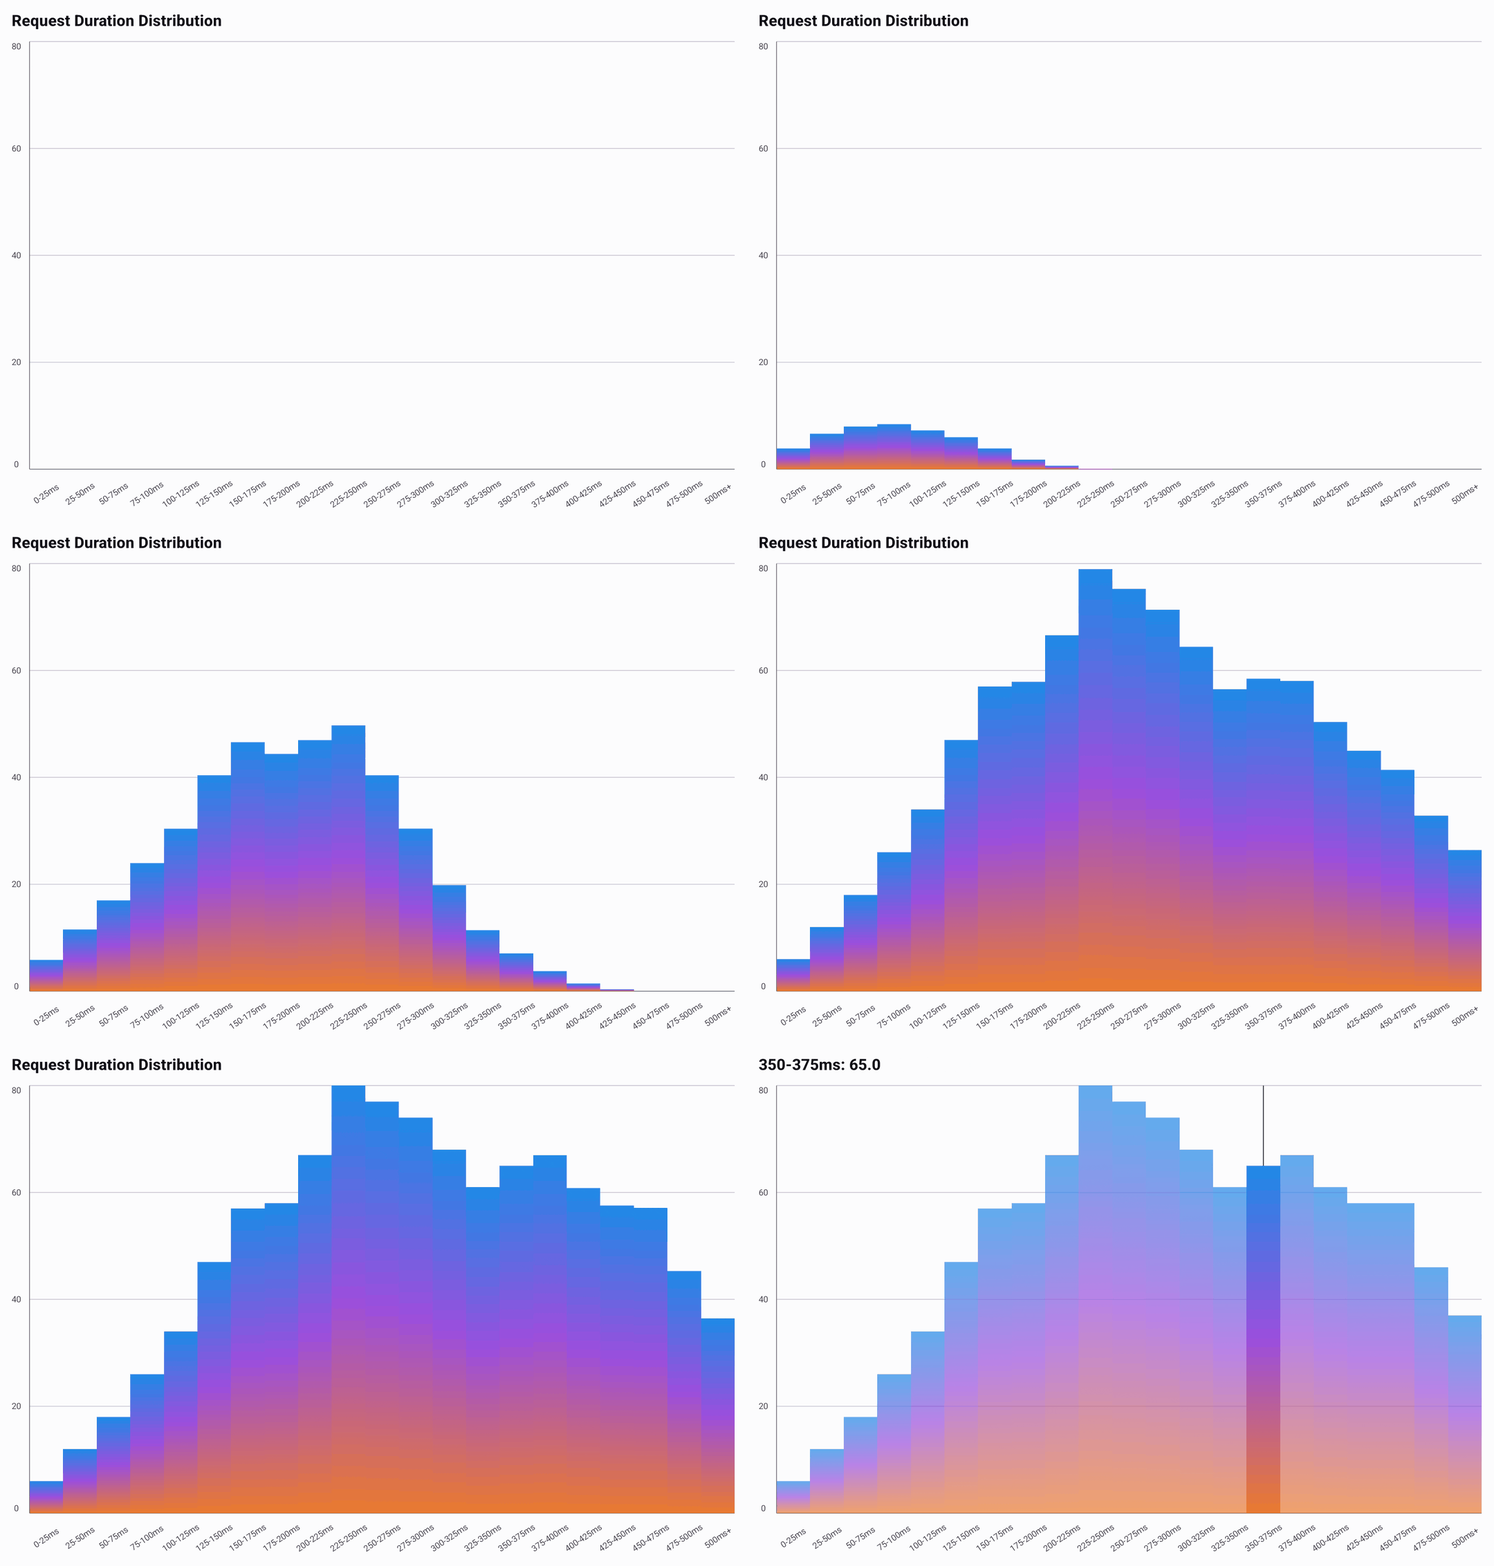
Histogram — Shape. The recording uses blue-purple-orange stops with ChartGradients.vertical(colors = colors, span = GradientSpan.Shape), passed through HistogramChartDefaults.bars(gradient = ...) in HistogramChartDefaults.style(...). Each bin shows the full gradient; a bin below zero mirrors it toward the baseline.
Recording source: HistogramGradientExample.kt.
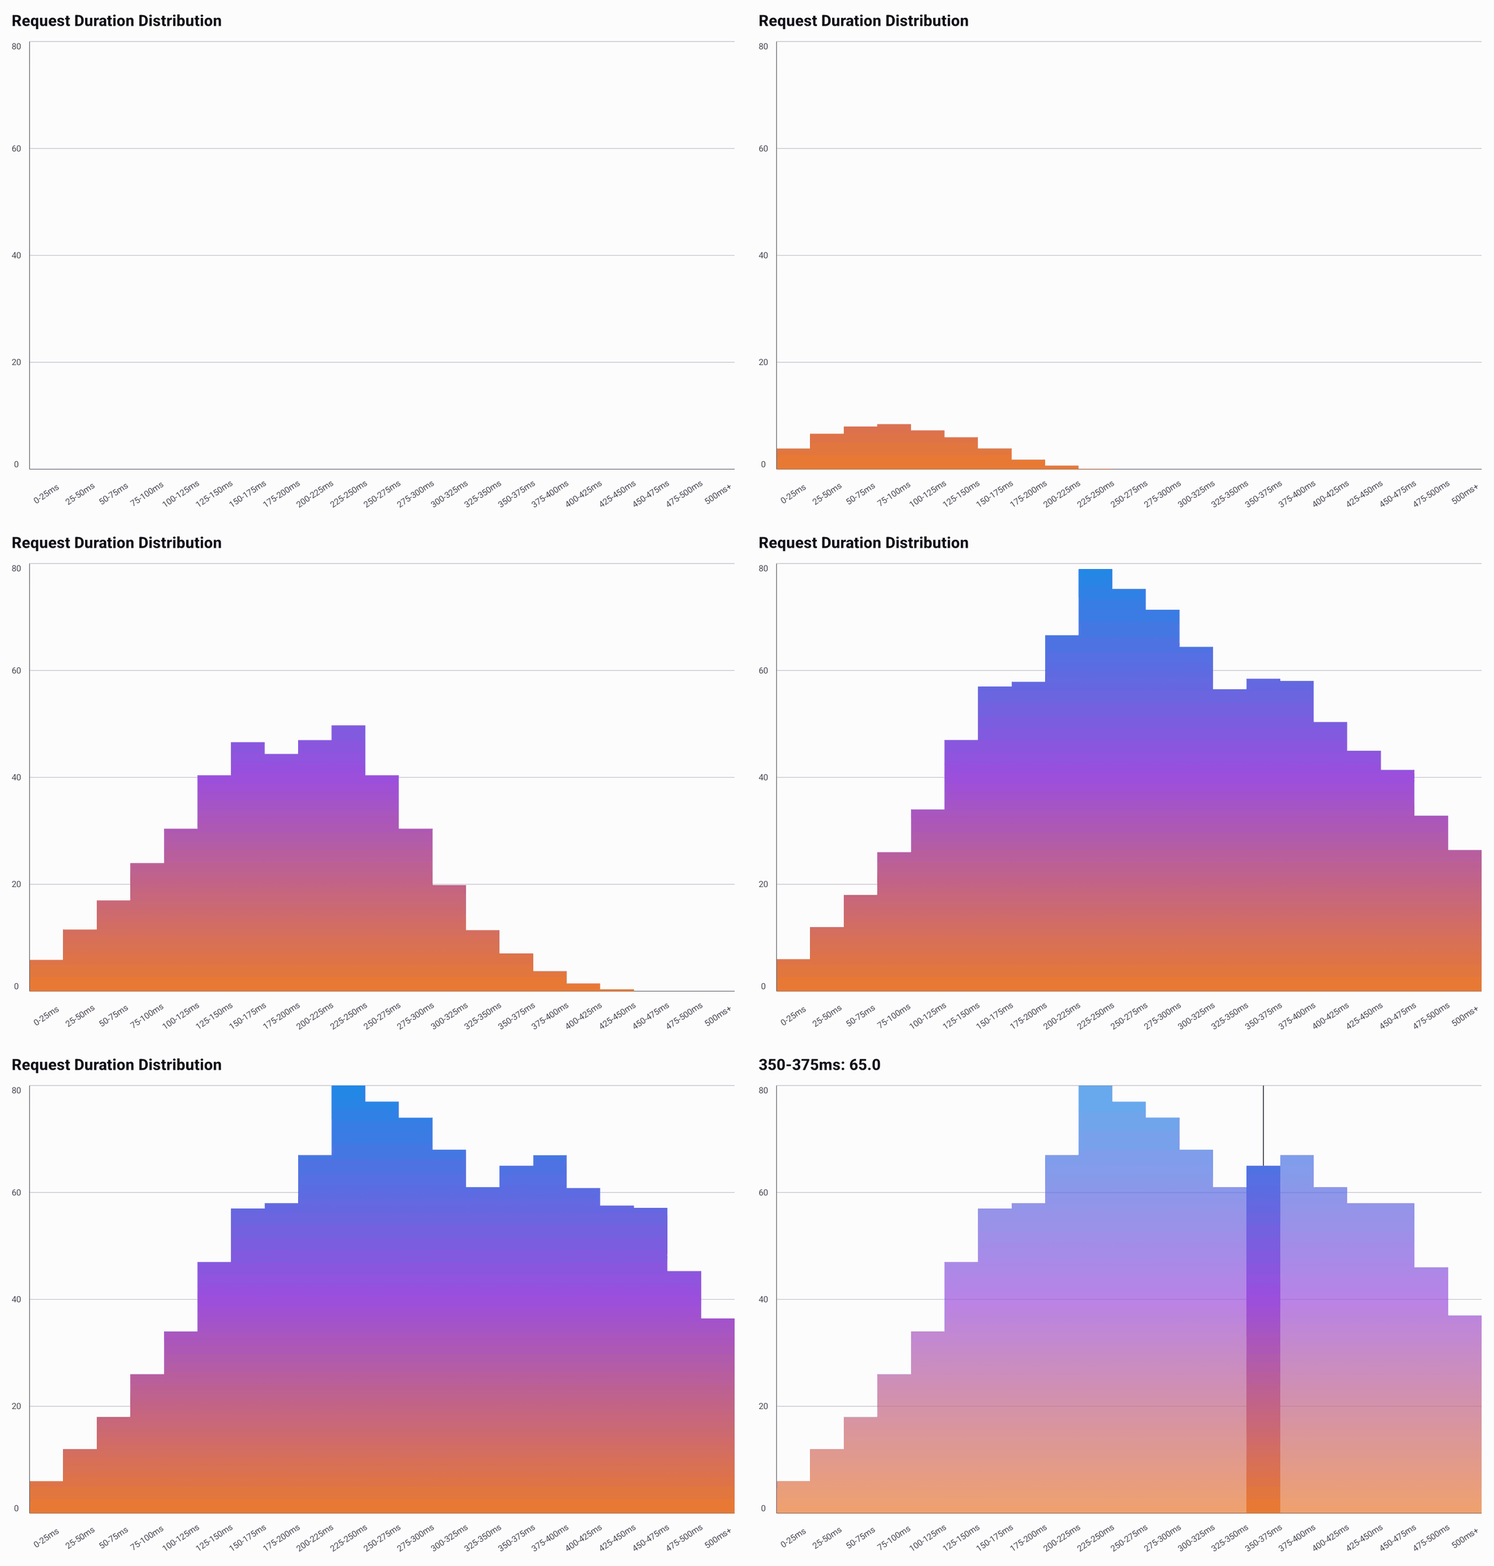
Histogram — Plot. The same stops use ChartGradients.vertical(colors = colors, span = GradientSpan.Plot) with HistogramChartDefaults.bars(gradient = ...) in HistogramChartDefaults.style(...). Taller bins reach farther toward the top color in the plot-spanning gradient.
Recording source: HistogramGradientExample.kt.
A horizontal plot gradient runs from the left side of the plot to its right. In dense scrollable charts, plot-spanning gradients cover the full series and move with the scrolling content.
Ready-Made Gradients
ChartGradients spaces fixed colors evenly between the start and end points.
| Factory | Direction and behavior |
|---|---|
vertical(colors, span) | Top to bottom. Shape-spanning bars mirror below zero. |
horizontal(colors, span) | Left to right. |
linear(angleDegrees, colors, span) | Clockwise from left to right; 45f runs top-left to bottom-right. Positions use normalized bounds, so at other angles a non-square shape can hold end colors near corners. |
fade(endAlpha, span) | Top to bottom from each shape's resolved series color to that color at endAlpha. |
fade() uses GradientStop.Series, so each series keeps its own color. Fixed-color gradients use
GradientStop.Fixed and paint the same colors on each series. A chart style's color supplies the series
color used by series stops, and the style alpha multiplies the complete gradient. This makes a series
gradient the useful choice when a chart legend needs to remain visually matched to its shapes. Stacked
bar and stacked area styles apply one gradient to all segments or layers; they do not accept a separate
gradient per series.
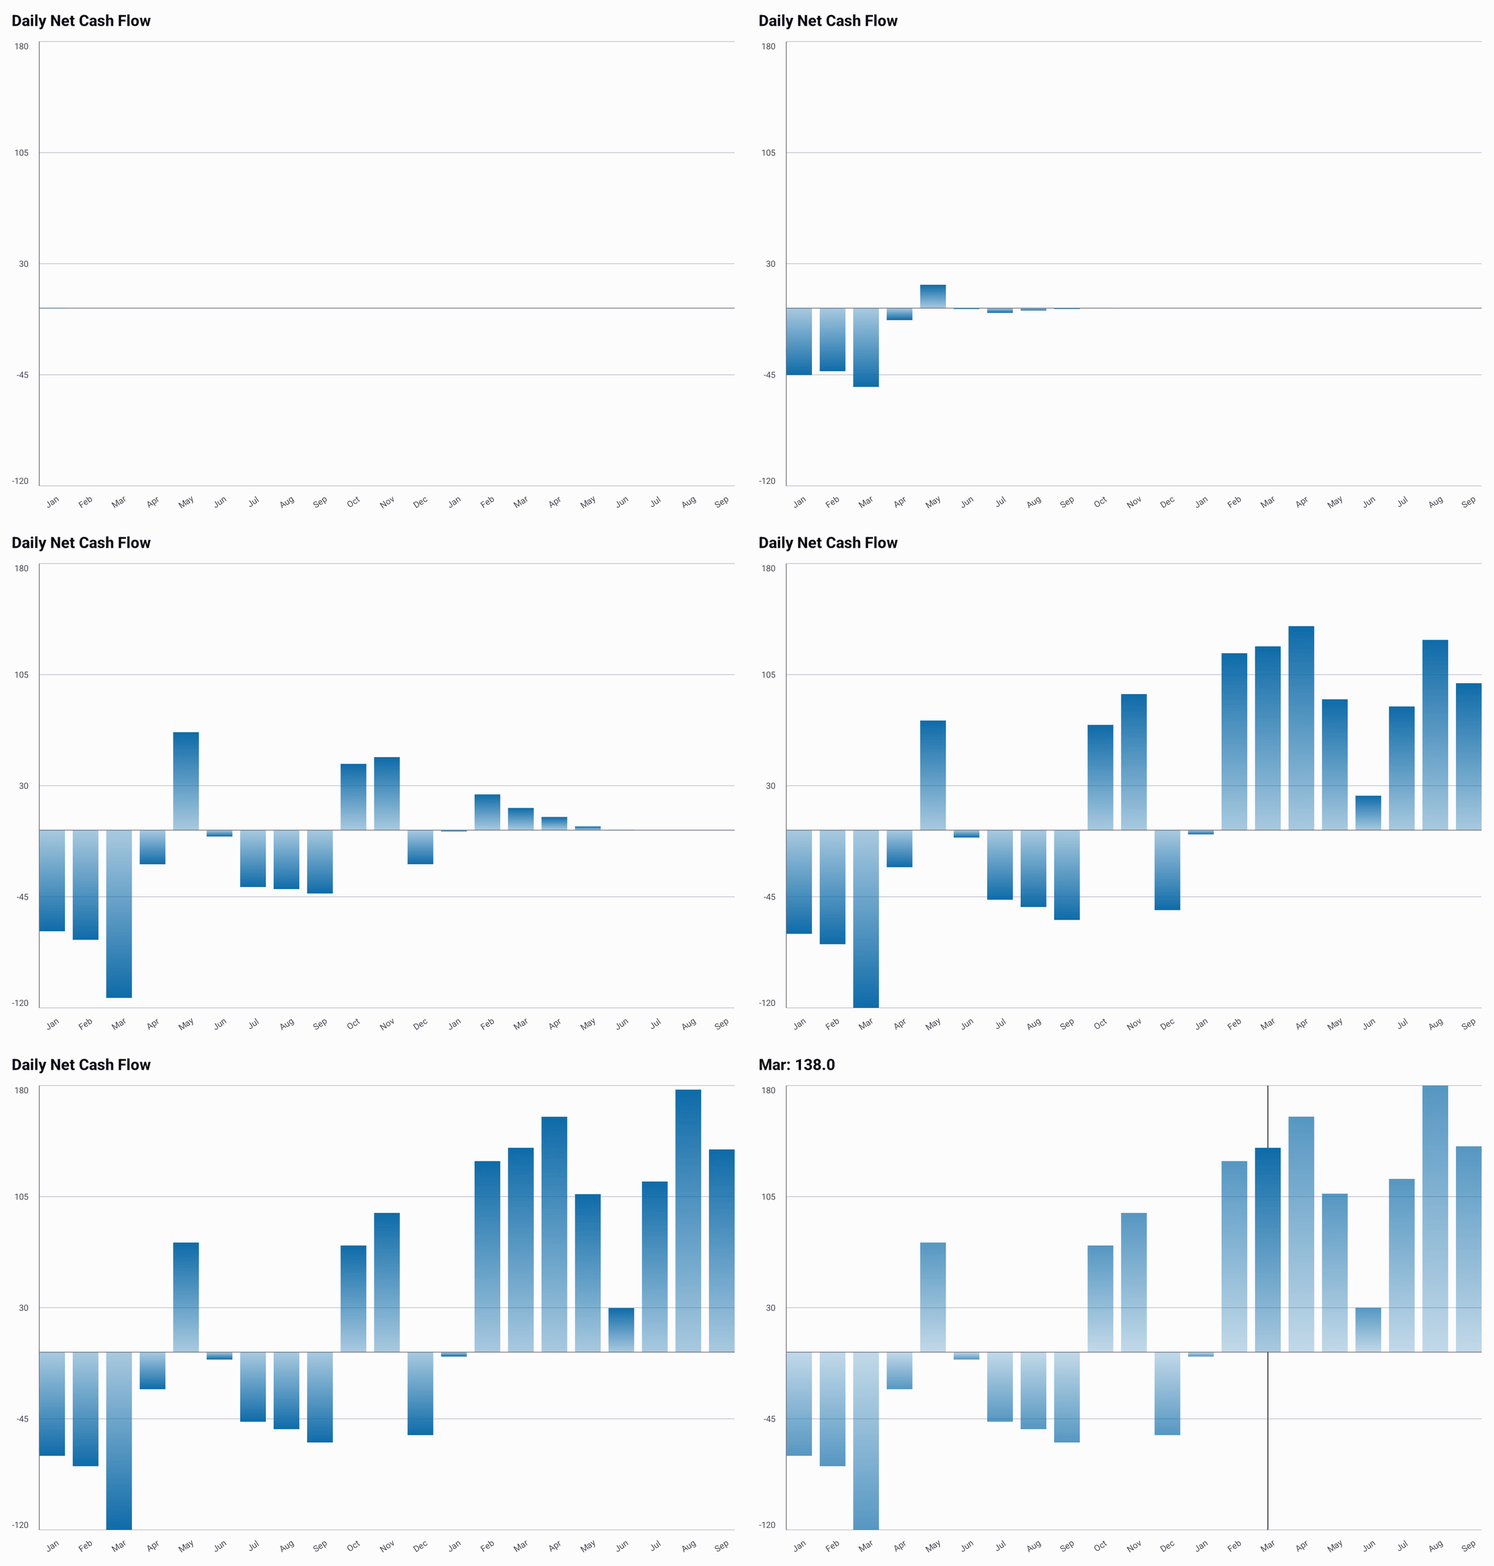
Bar fade. ChartGradients.fade(endAlpha = 0.35f) goes to BarChartDefaults.bars(gradient = ...) inside BarChartDefaults.style(...). Each bar fades its resolved color toward the baseline; negative bars mirror the fade around zero.
Recording source: BarGradientExample.kt.
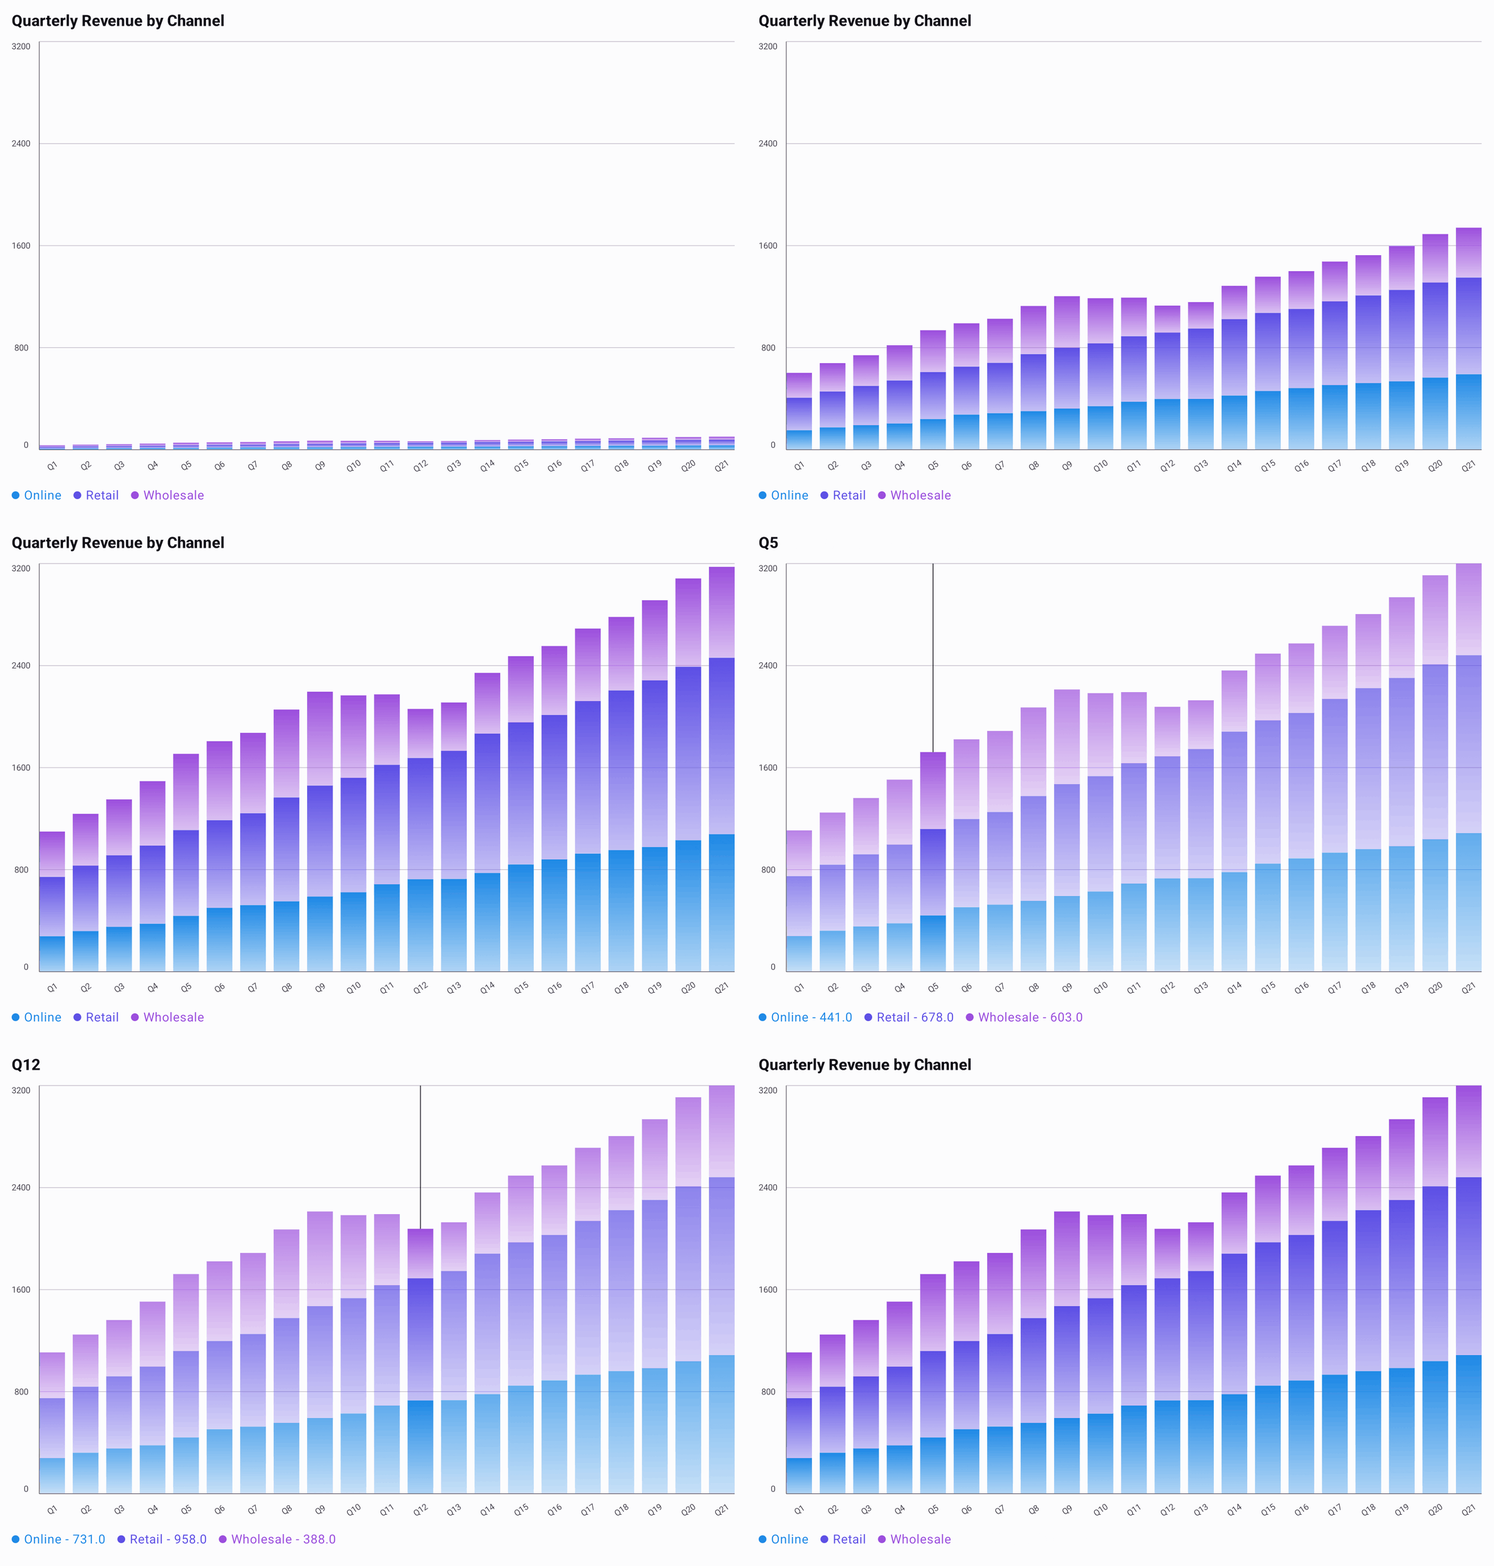
Stacked bar fade. StackedBarChartDefaults.segments(colors = seriesColors, gradient = ChartGradients.fade(endAlpha = 0.35f)) is used by StackedBarChartDefaults.style(segments = ...). The fade preserves each segment's series color.
Recording source: StackedBarGradientExample.kt.
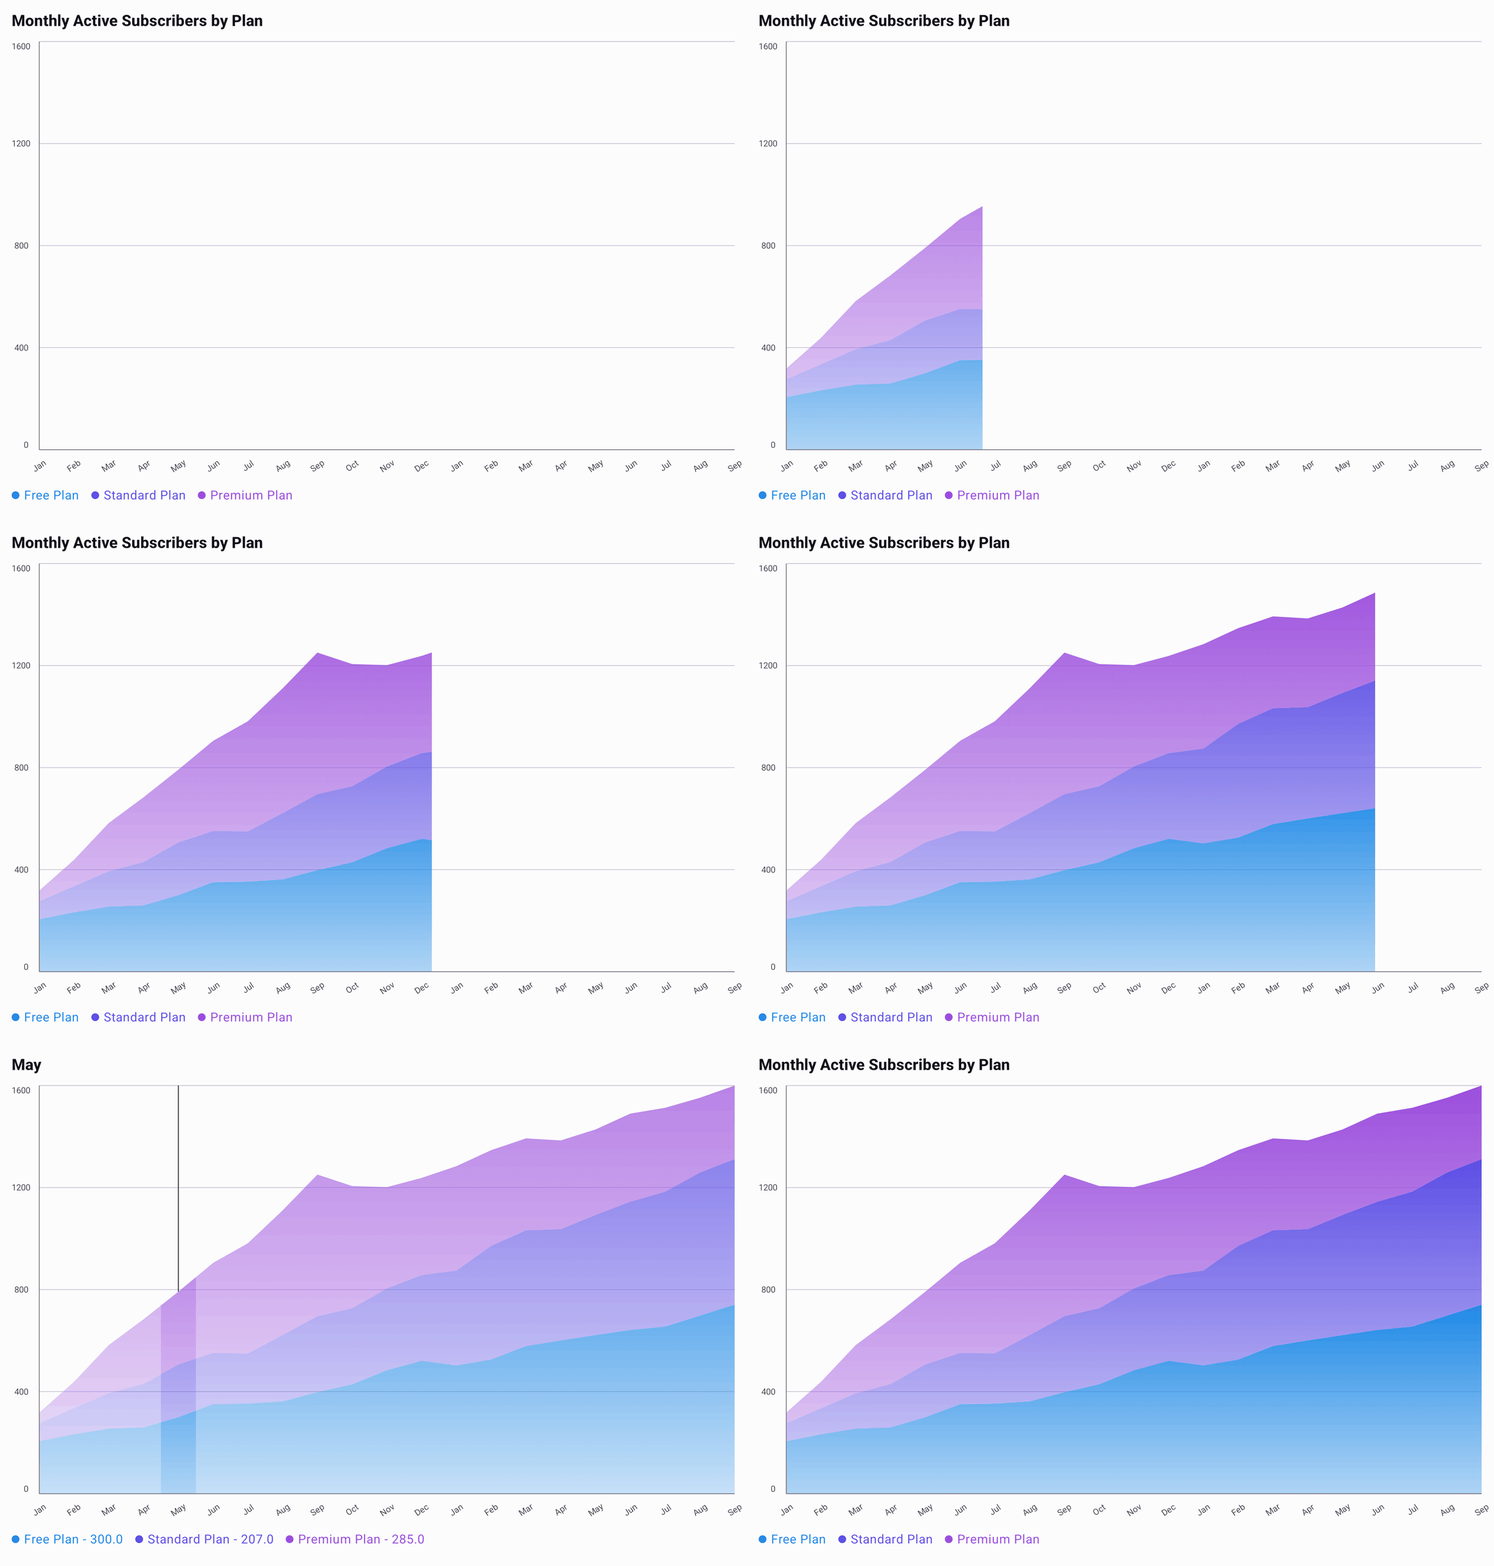
Stacked area fade. StackedAreaChartDefaults.fill(colors = seriesColors, gradient = ChartGradients.fade(endAlpha = 0.35f)) is used by StackedAreaChartDefaults.style(fill = ...). Each layer fades while retaining its series color.
Recording source: StackedAreaGradientExample.kt.
Line gradients paint the stroke; points and selection markers keep their own colors. Shape uses the
line's bounds, while Plot follows the full plot. In LiveLineChart, a shape-spanning gradient follows
the visible line bounds as they change. See the line gradient example.
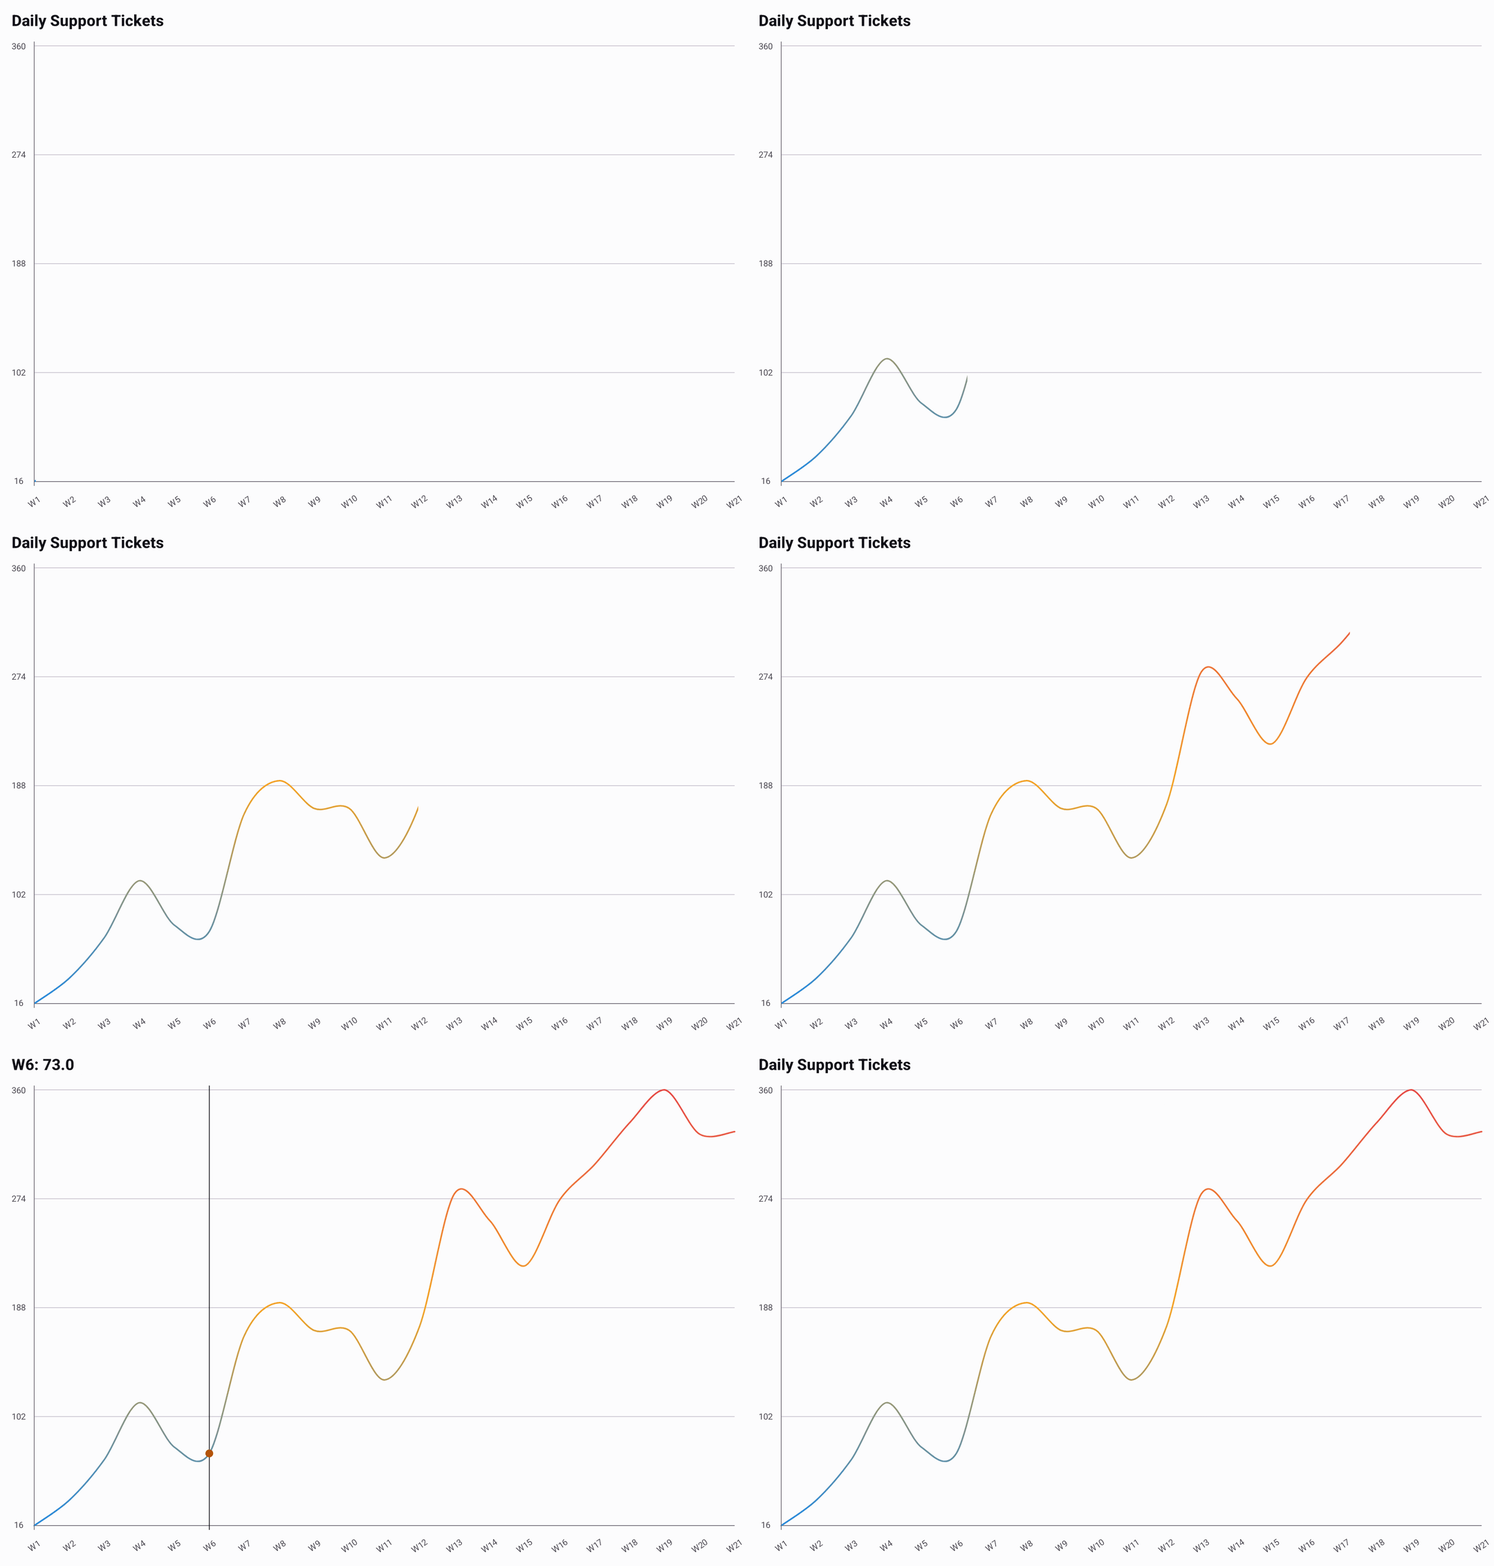
Line — Plot. The red-orange-blue stops use ChartGradients.vertical(colors = valueColors, span = GradientSpan.Plot) with LineChartDefaults.line(gradient = ...) in LineChartDefaults.style(line = ...). Color follows value across the full plot; points and selection markers keep their own colors.
Recording source: LineGradientExample.kt.
Custom Stops and Geometry
Use ChartGradient.Linear when a gradient needs an accent stop or custom endpoints. GradientPoint
coordinates are fractions of the selected bounds: (0, 0) is top-left and (1, 1) bottom-right.
Offsets run from 0 at start to 1 at end. A Fixed stop keeps its given color; a Series stop
uses the shape's resolved color at the specified alpha.
This compiled example keeps the cash-flow color at each end and adds a white highlight between them.
import androidx.compose.runtime.Composable
import androidx.compose.ui.graphics.Color
import androidx.compose.ui.graphics.TileMode
import io.github.hdcharts.bar.BarChart
import io.github.hdcharts.core.model.toChartData
import io.github.hdcharts.core.style.BarChartDefaults
import io.github.hdcharts.core.style.ChartGradient
import io.github.hdcharts.core.style.GradientPoint
import io.github.hdcharts.core.style.GradientSpan
import io.github.hdcharts.core.style.GradientStop

@Composable
fun HighlightCashFlowExtremes() {
    val data =
        listOf(45.0, -12.0, 38.0, 27.0, -19.0).toChartData(
            categories = listOf("Mon", "Tue", "Wed", "Thu", "Fri"),
            seriesName = "Net cash flow",
        )
    val gradient =
        ChartGradient.Linear(
            stops =
                listOf(
                    GradientStop.Series(offset = 0f, alpha = 1f),
                    GradientStop.Fixed(offset = 0.55f, color = Color.White),
                    GradientStop.Series(offset = 1f, alpha = 0.25f),
                ),
            start = GradientPoint(x = 0f, y = 0f),
            end = GradientPoint(x = 1f, y = 1f),
            span = GradientSpan.Shape,
            tileMode = TileMode.Clamp,
        )

    BarChart(
        data = data,
        title = "Cash flow with a highlight",
        style = BarChartDefaults.style(bars = BarChartDefaults.bars(gradient = gradient)),
    )
}
Invalid Values
Charts clamp gradient input when drawing. Offsets outside 0..1 are clamped, stops are sorted by
offset, and non-finite offsets are dropped. Equal offsets create a hard color edge. Series alpha is
clamped to 0..1. A single remaining stop paints a solid color; no usable stops, non-finite endpoints,
or identical start and end points fall back to the style's solid shape color.