
Stacked Bar Chart
Overview
StackedBarChart compares how multiple nonnegative series contribute to each category total. Use it
when both the overall total and the series contributions matter. Each series must provide one value
for every category, in the same order.
implementation("io.github.hdcharts:stacked-bar:3.1.0")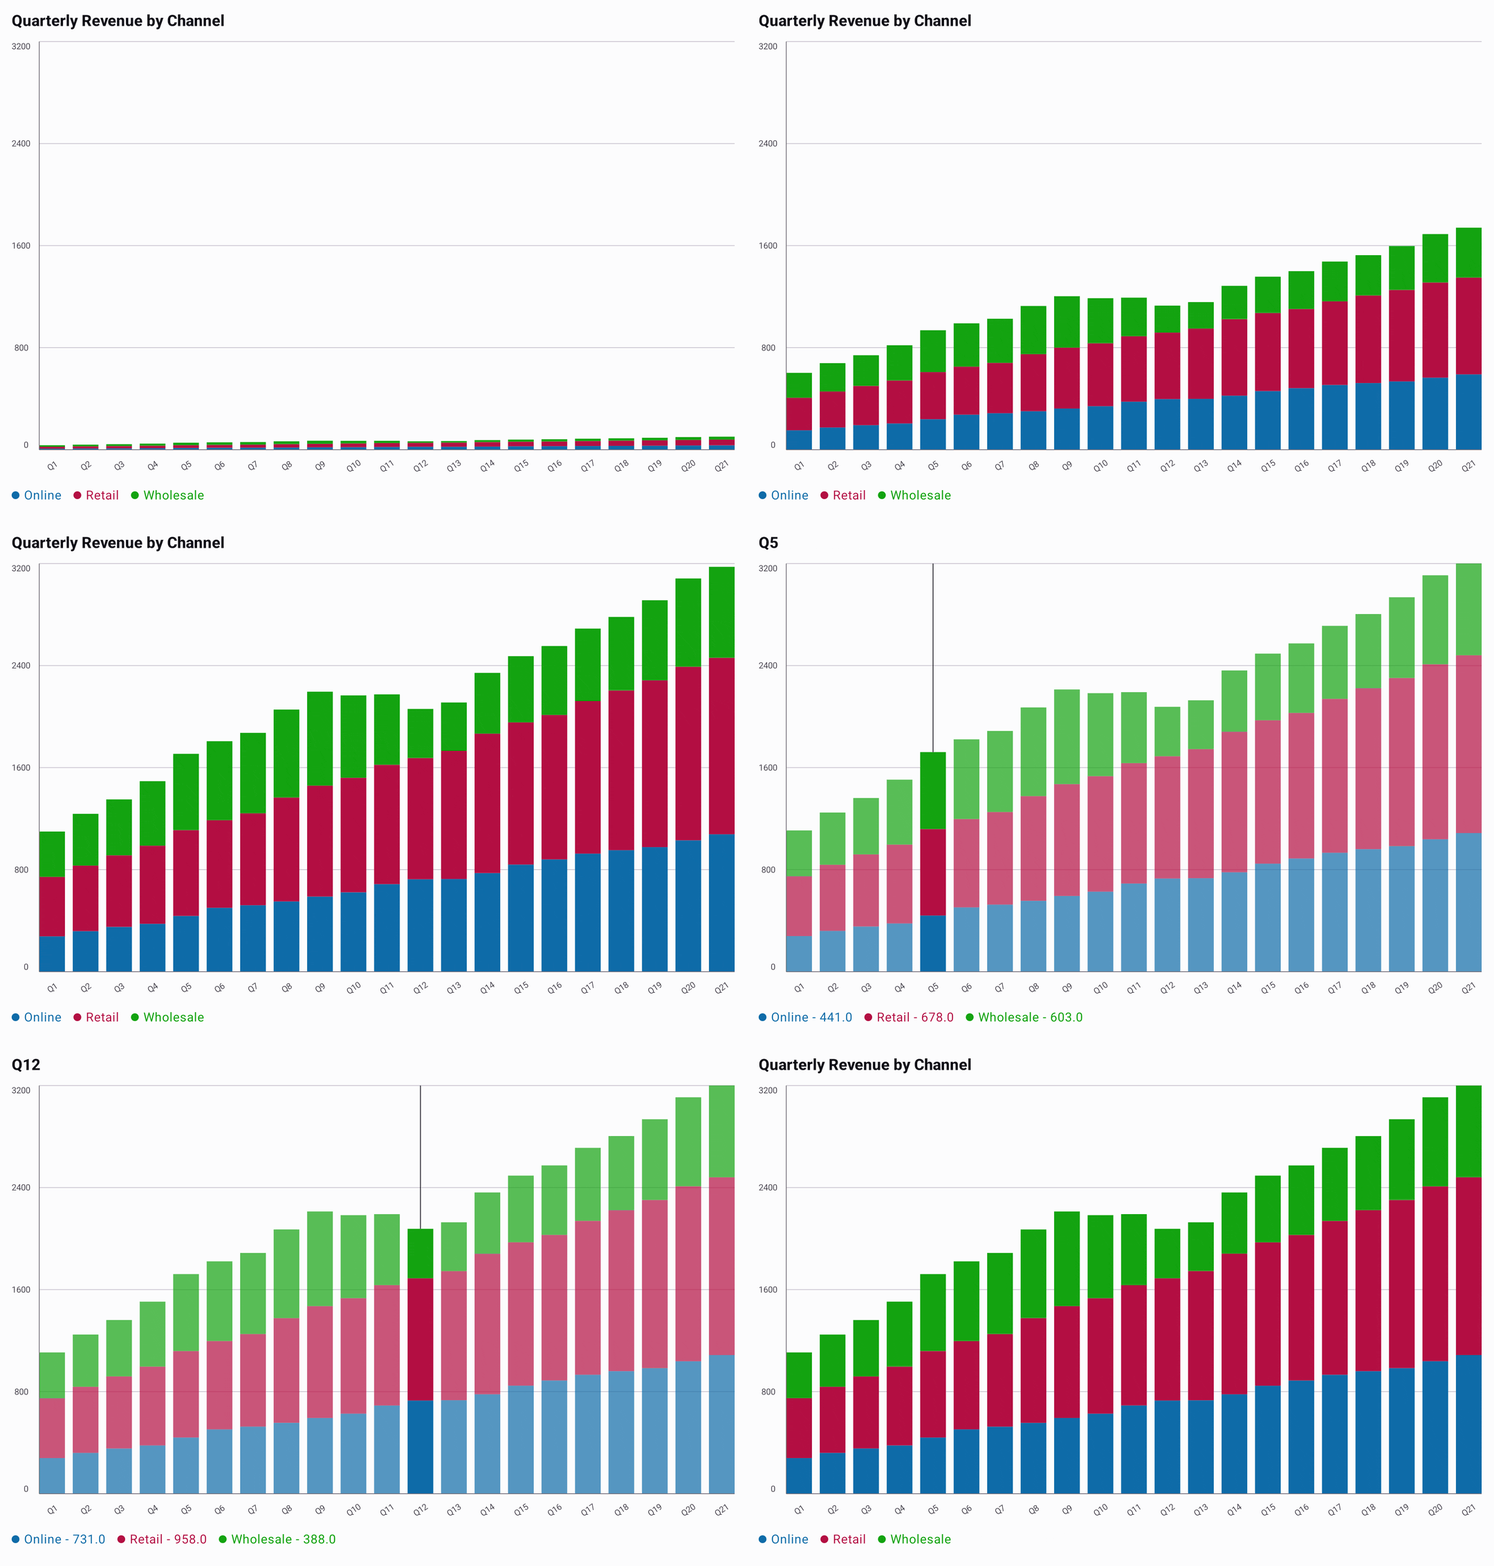
Recording source: StackedBarExample.kt.
Basic Usage
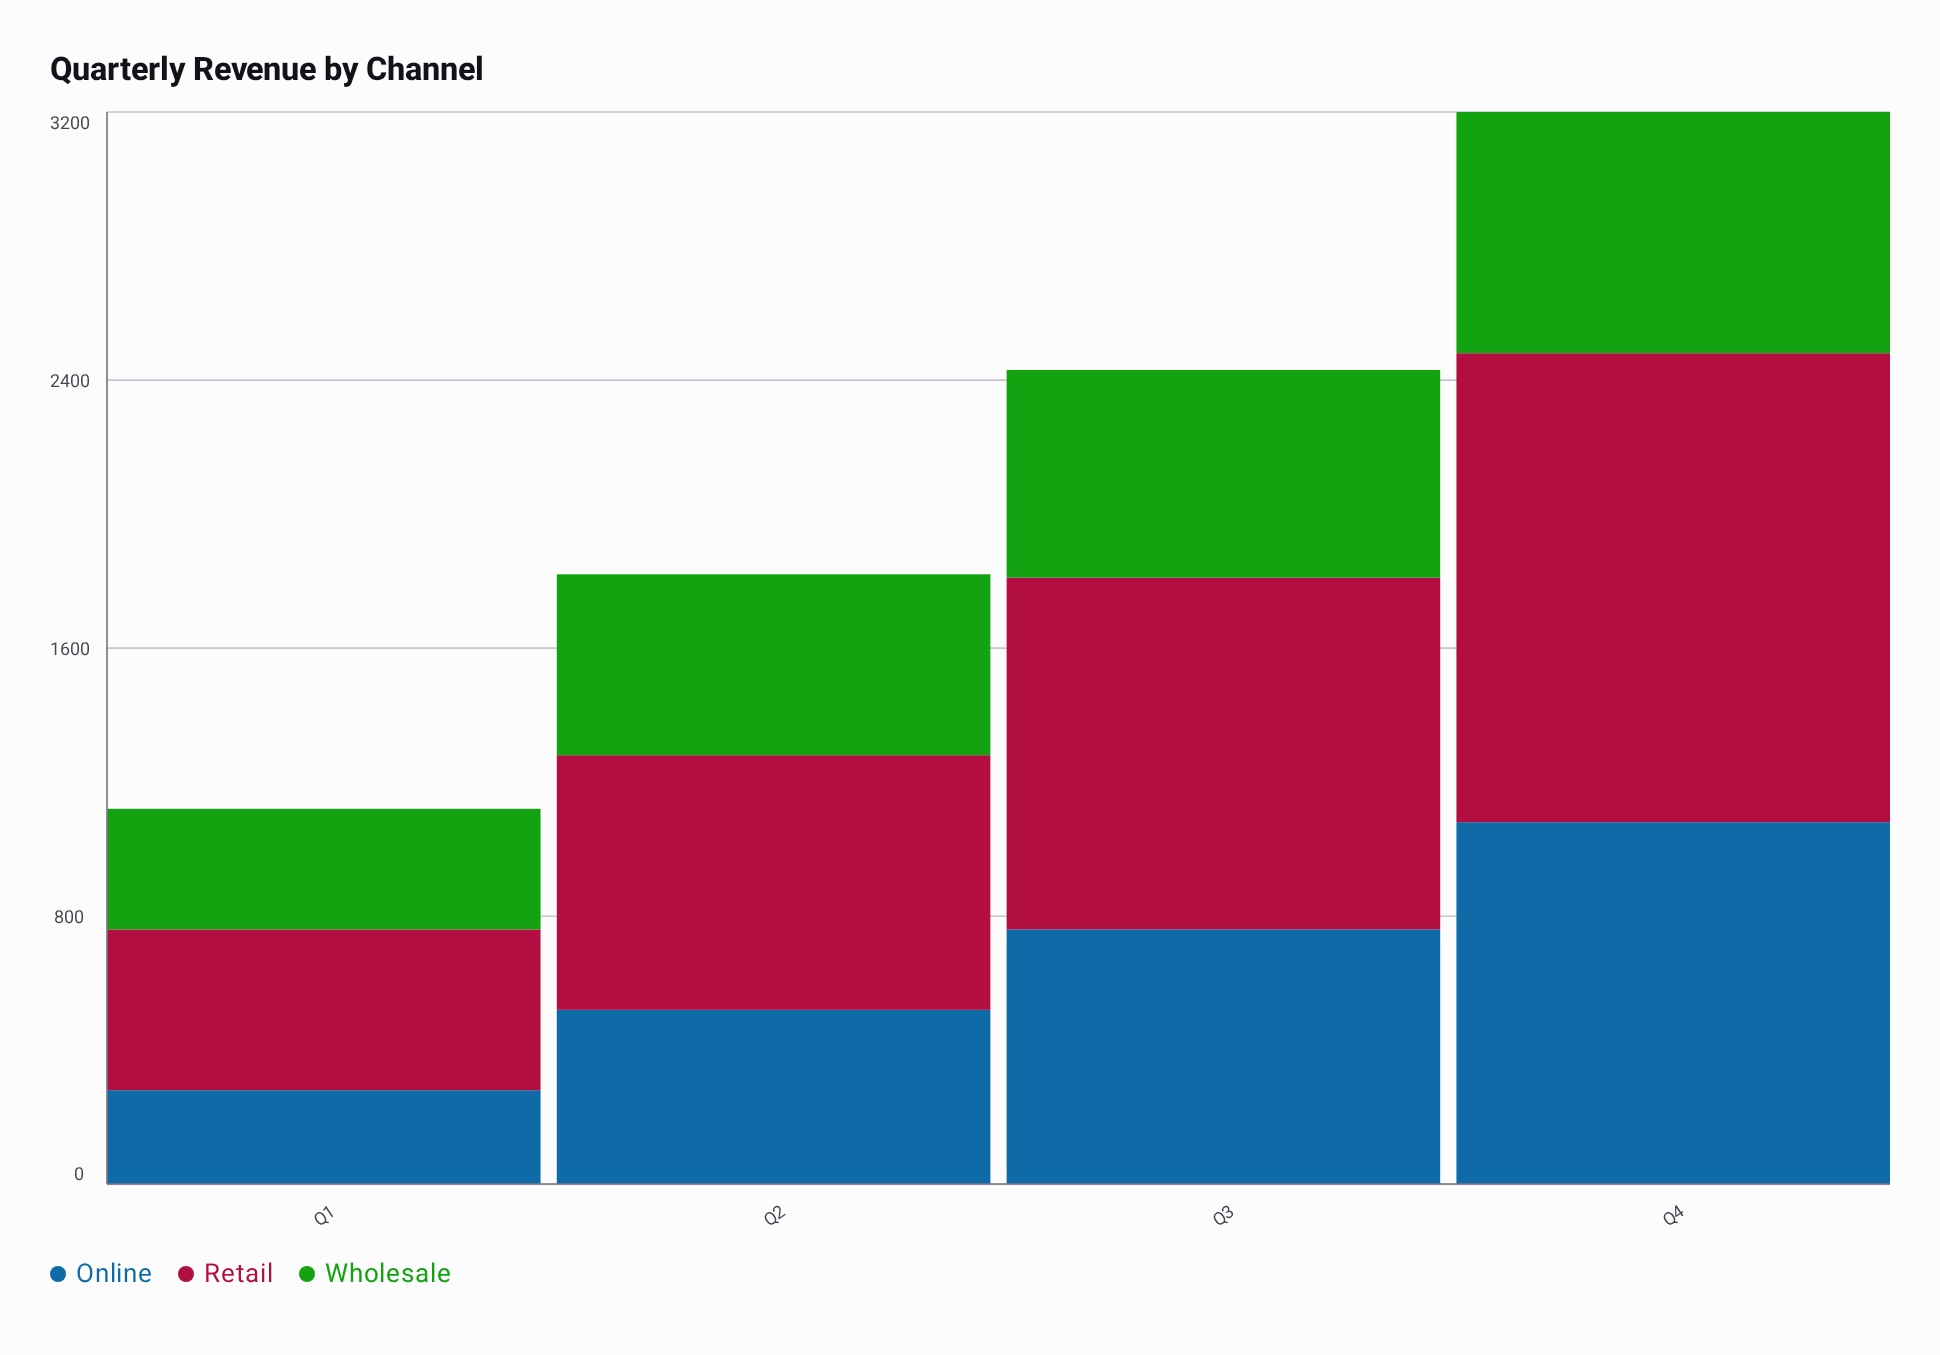
Each channel has one quarterly revenue value per category. Values at the same index stack into that quarter's total bar; segment colors follow the series order.
import androidx.compose.runtime.Composable
import androidx.compose.ui.Modifier
import io.github.hdcharts.core.model.toChartData
import io.github.hdcharts.stackedbar.StackedBarChart

@Composable
fun ShowQuarterlyRevenue(modifier: Modifier = Modifier) {
    val data =
        listOf(
            "Online" to listOf(280.0, 520.0, 760.0, 1_080.0),
            "Retail" to listOf(480.0, 760.0, 1_050.0, 1_400.0),
            "Wholesale" to listOf(360.0, 540.0, 620.0, 720.0),
        ).toChartData(categories = listOf("Q1", "Q2", "Q3", "Q4"))

    StackedBarChart(
        data = data,
        modifier = modifier,
        title = "Quarterly Revenue by Channel",
    )
}
Capabilities
Value Formatting
When a category is selected, selectedValueFormatter formats each channel's value in the legend.
It does not replace the category with an aggregate total. axisValueFormatter formats Y-axis ticks,
which represent cumulative stack heights. This excerpt reuses data from Basic Usage.
@Composable
fun FormattedQuarterlyRevenue(data: ChartData) {
    StackedBarChart(
        data = data,
        selectedValueFormatter = ChartValueFormatters.prefix("$"),
        axisValueFormatter =
            ChartValueFormatter { value ->
                "$" + StackedBarChartDefaults.axisValueFormatter.format(value)
            },
    )
}
Fade Gradient
The fade follows each series color, keeping the channel identity visible through each segment. This
excerpt reuses data from Basic Usage. See the shared Gradients guide for
gradient spans and custom stops.
@Composable
fun FadedQuarterlyRevenue(data: ChartData) {
    StackedBarChart(
        data = data,
        style =
            StackedBarChartDefaults.style(
                segments =
                    StackedBarChartDefaults.segments(
                        gradient = ChartGradients.fade(endAlpha = 0.35f),
                    ),
            ),
    )
}