Pie Chart
Overview
PieChart compares parts of a whole as proportional slices. Use one series with at least two
nonnegative finite values. Categories are optional; when supplied, each names a slice in the legend
and while it is selected.
implementation("io.github.hdcharts:pie:3.1.0")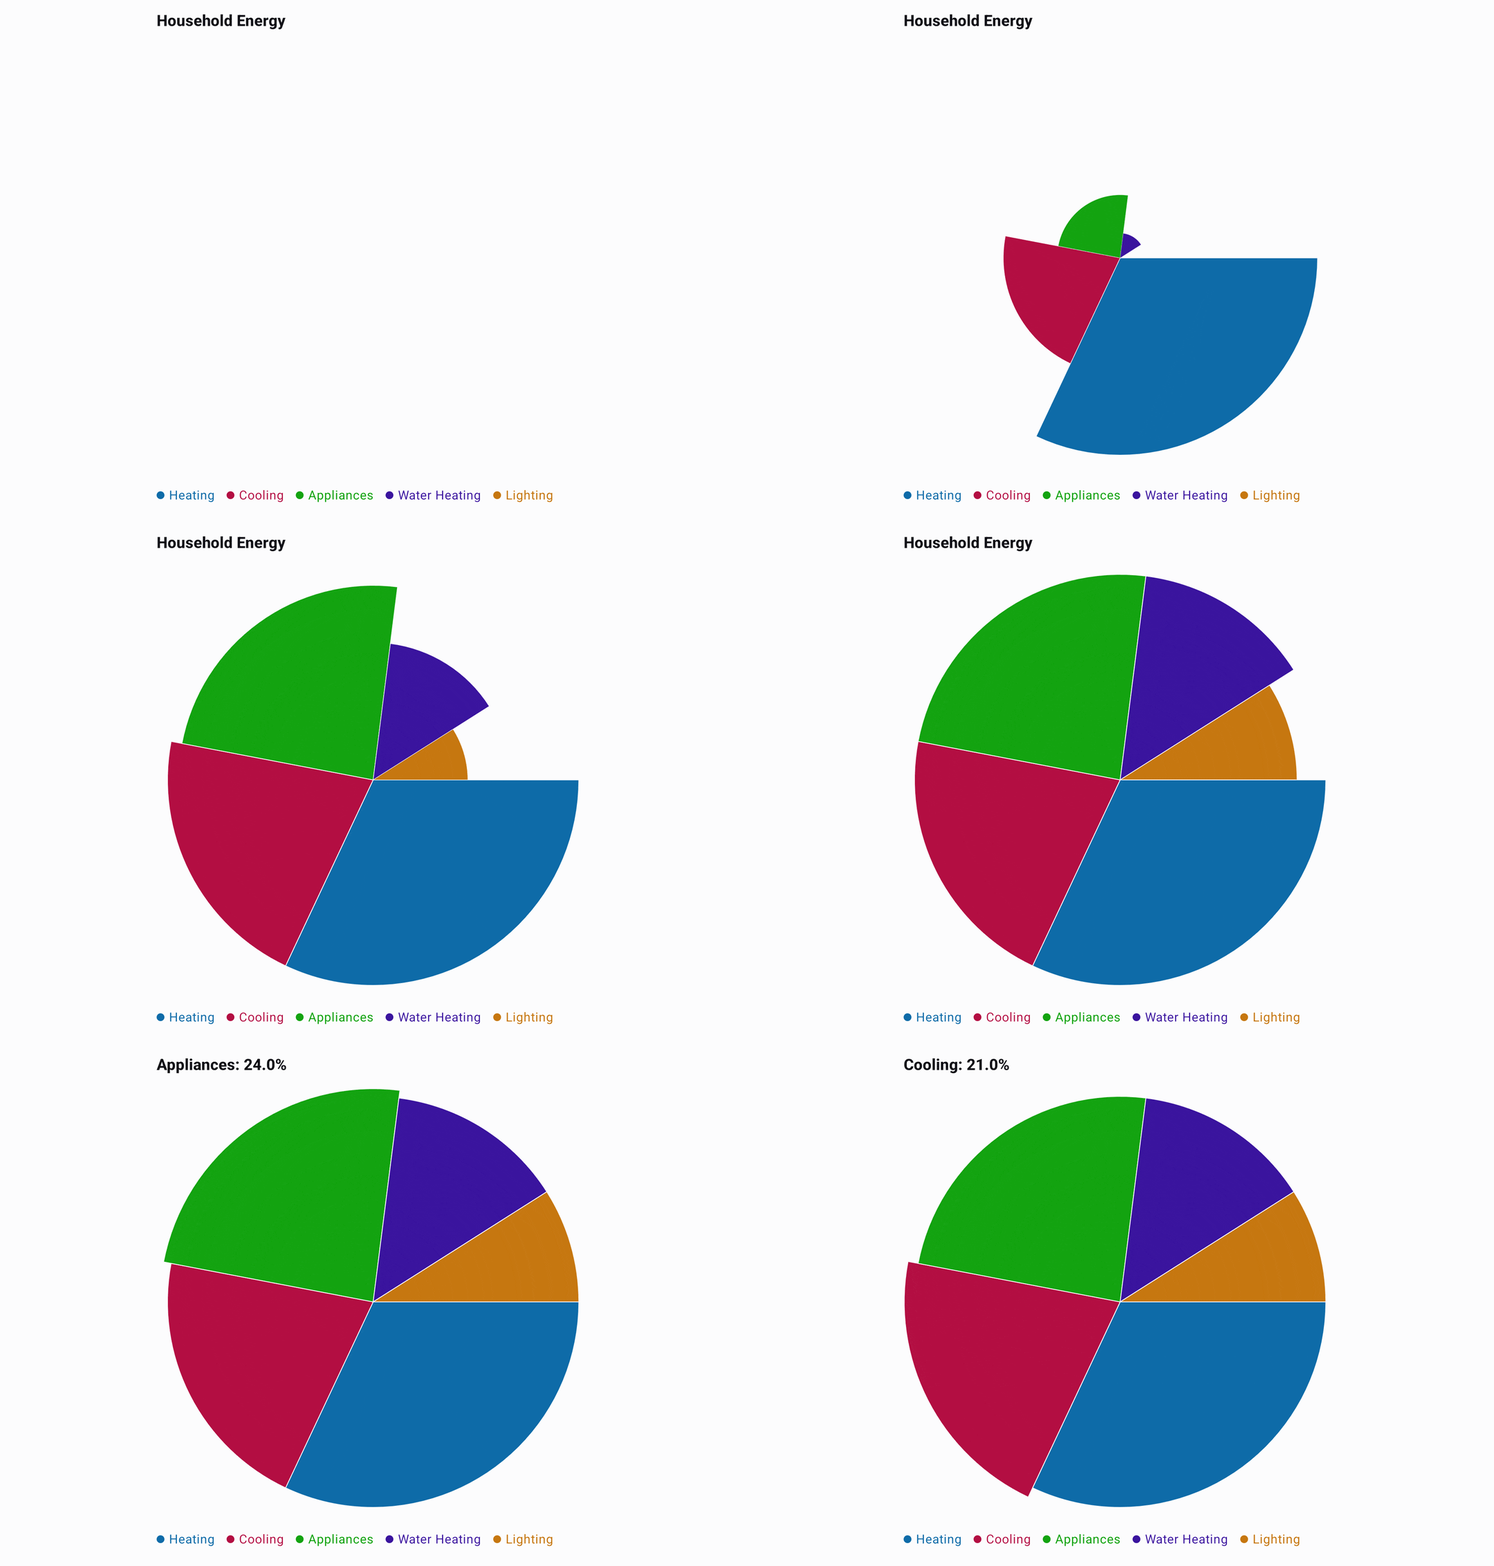
Slice colors come from the style, either as an explicit palette or as shades generated from its base color. Without categories the chart has no legend. With no category and no title, a selected slice shows only its share.
Recording source: PieExample.kt.
Basic Usage
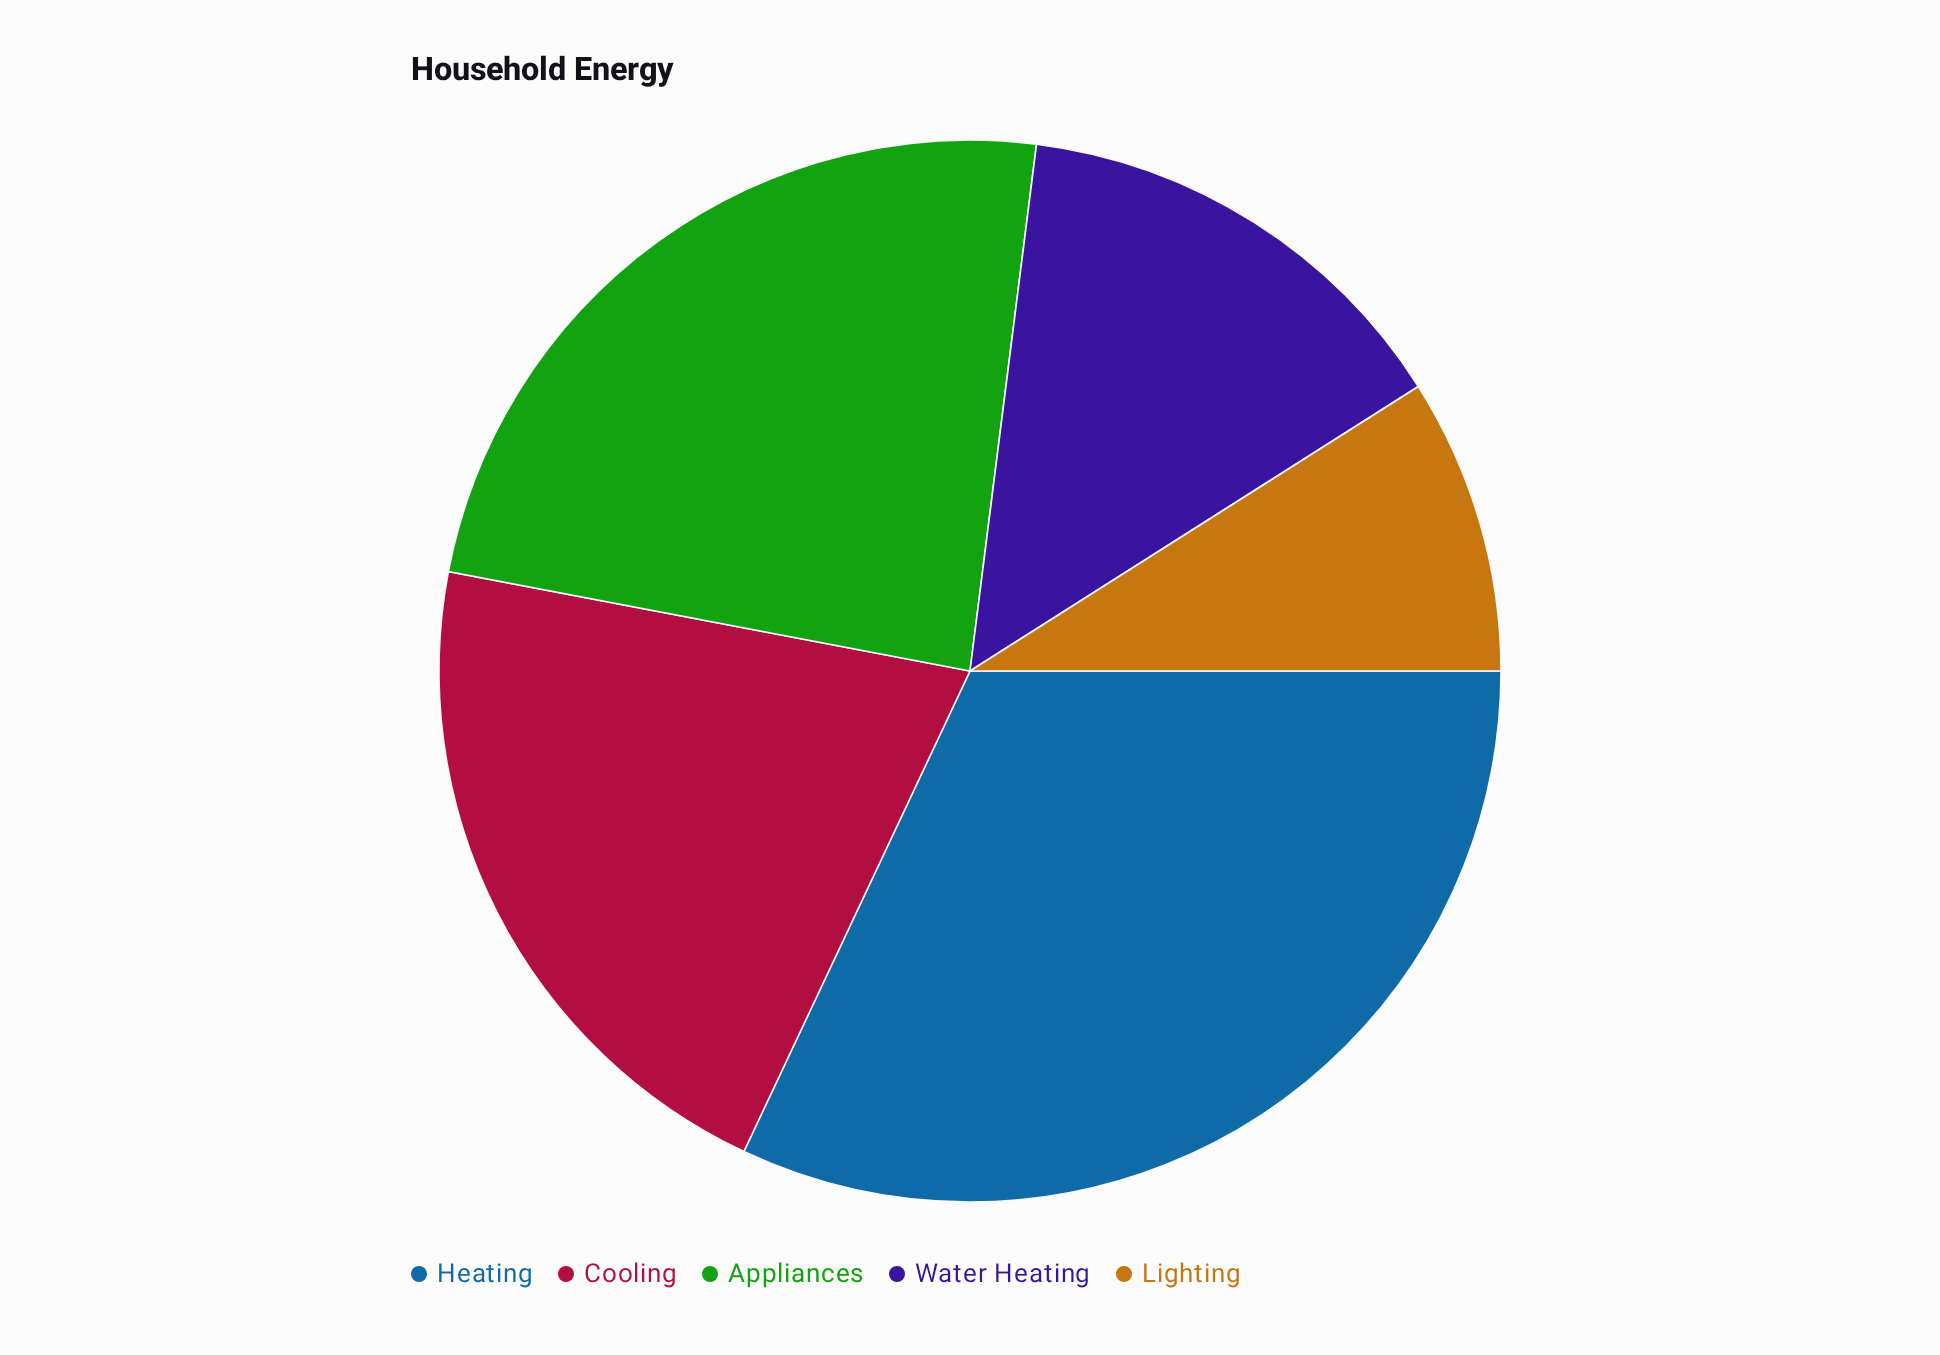
This complete example maps application data with toChartData() and renders it with the public
PieChart composable.
import androidx.compose.runtime.Composable
import io.github.hdcharts.core.model.toChartData
import io.github.hdcharts.pie.PieChart

internal data class EnergyUsage(
    val category: String,
    val consumption: Double,
) {
    companion object {
        val sample =
            listOf(
                EnergyUsage("Heating", 32.0),
                EnergyUsage("Cooling", 21.0),
                EnergyUsage("Appliances", 24.0),
                EnergyUsage("Water Heating", 14.0),
                EnergyUsage("Lighting", 9.0),
            )
    }
}

@Composable
fun ShowPie() {
    val energyUsage = EnergyUsage.sample
    val data =
        energyUsage.toChartData(
            value = { it.consumption },
            category = { it.category },
        )

    PieChart(data = data, title = "Household Energy")
}
Capabilities
Slice Colors
Set one color per slice, in slice order. The chart reports a validation error when the palette size
does not match the slice count. This excerpt reuses data from Basic Usage.
@Composable
fun ShowPieWithSliceColors(data: ChartData) {
    val colors = listOf(Color.Red, Color.Green, Color.Blue, Color.Yellow, Color.Magenta)

    PieChart(
        data = data,
        style =
            PieChartDefaults.style(
                slices = PieChartDefaults.slices(colors = colors),
            ),
    )
}
Selected Share
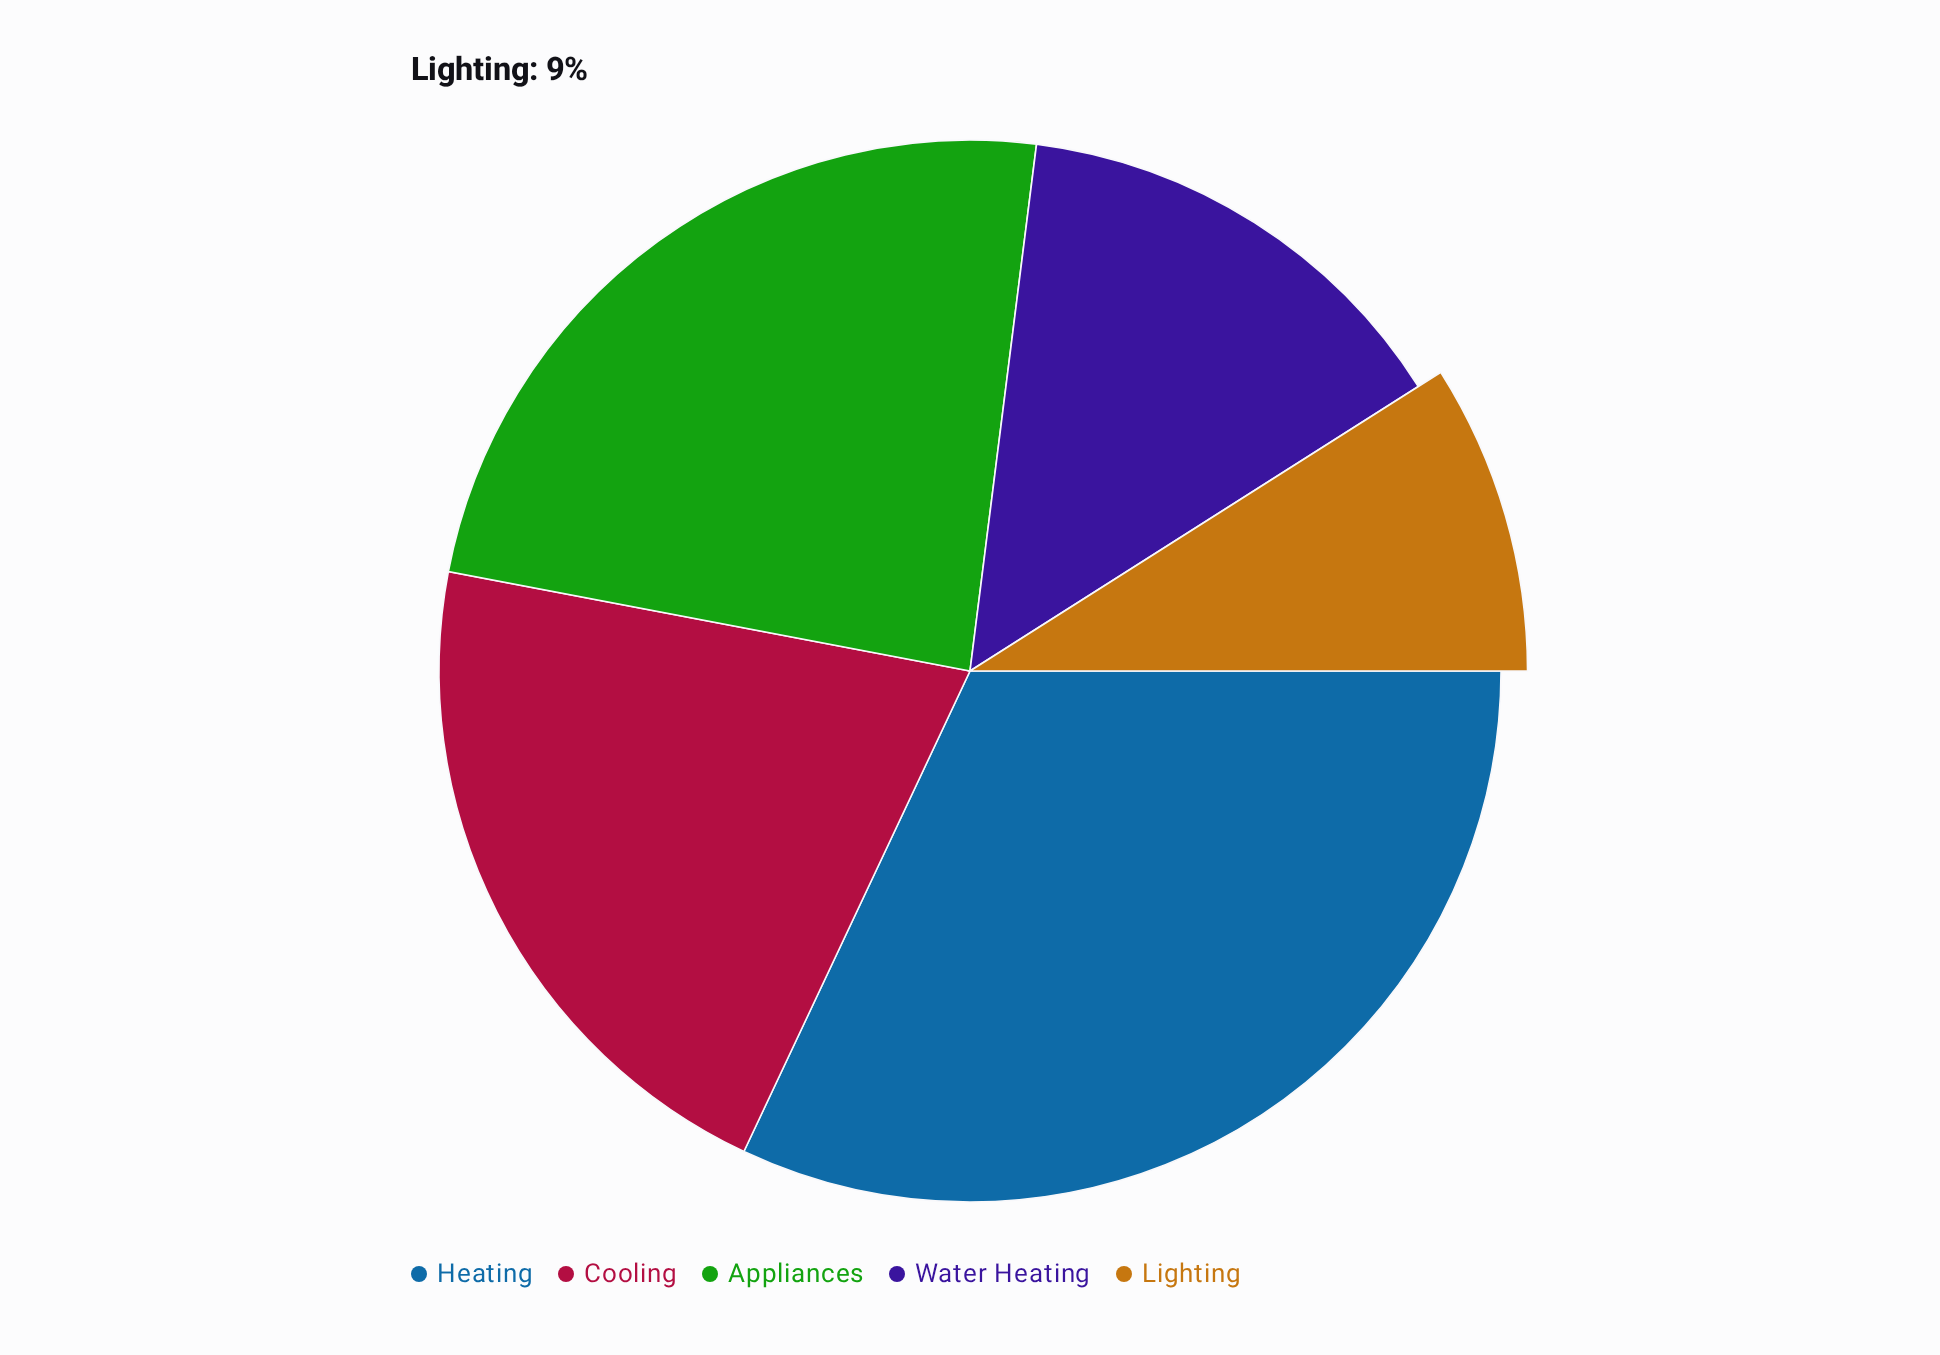
A selected slice shows its category and share of the total in the title, such as Lighting: 9% for
the Basic Usage data.
selectedValueFormatter formats that share, given in percent from 0 to 100. This one shows whole
percents and reuses data from Basic Usage:
@Composable
fun ShowPieWithRoundedShare(
    data: ChartData,
    selection: ChartSelection = rememberChartSelection(),
) {
    PieChart(
        data = data,
        selection = selection,
        selectedValueFormatter = ChartValueFormatter { share -> "${share.roundToInt()}%" },
    )
}