
Ring Gauge Chart
Overview
RingGaugeChart compares independent values on separate half-circle rings. Every value uses the same
configured range, and the first value is the outer ring. Use it for progress indicators such as separate team
workstreams. A Segmented Ring Gauge instead shows
contributions that add together toward one shared capacity.
implementation("io.github.hdcharts:gauge:3.1.0")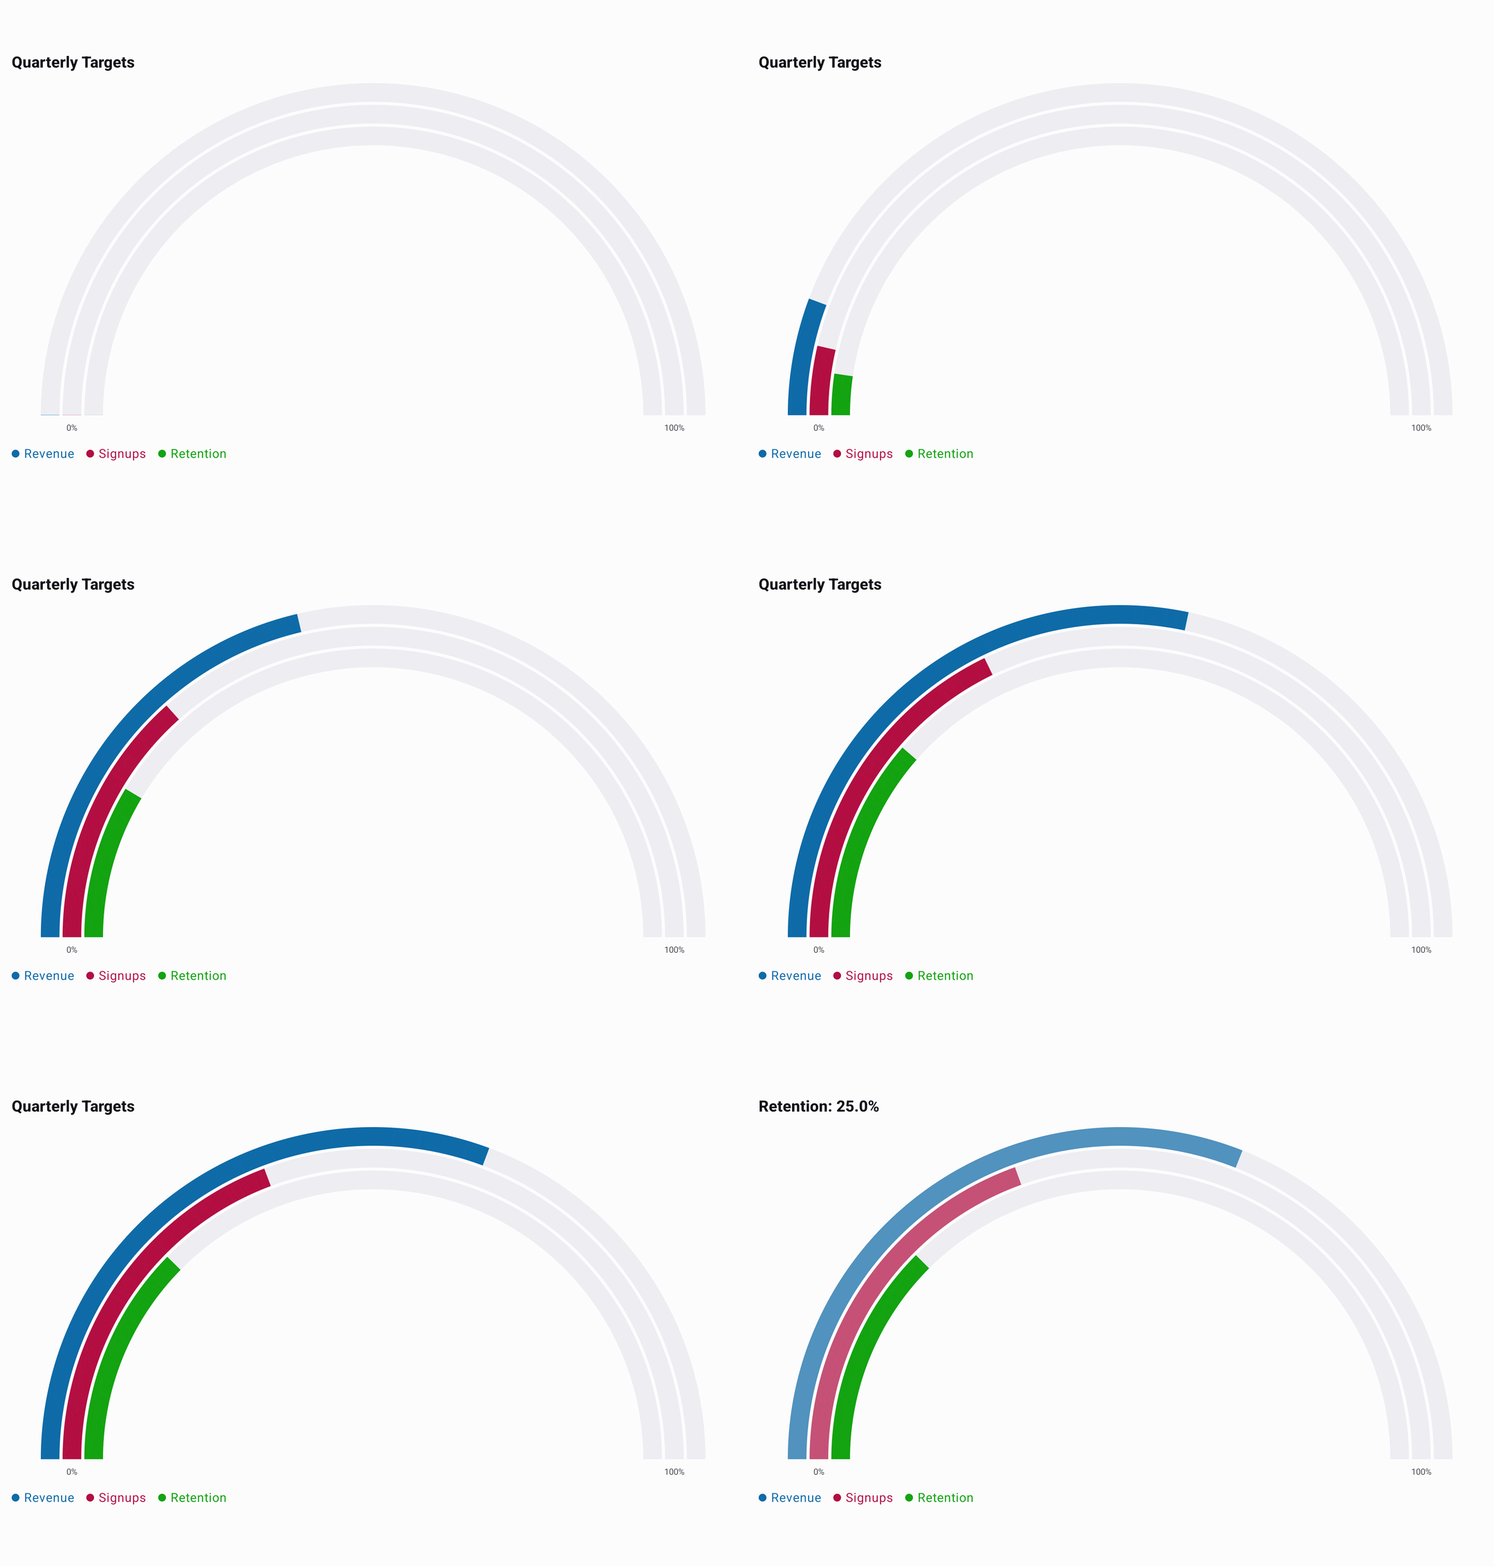
Recording source: RingGaugeExample.kt.
Basic Usage
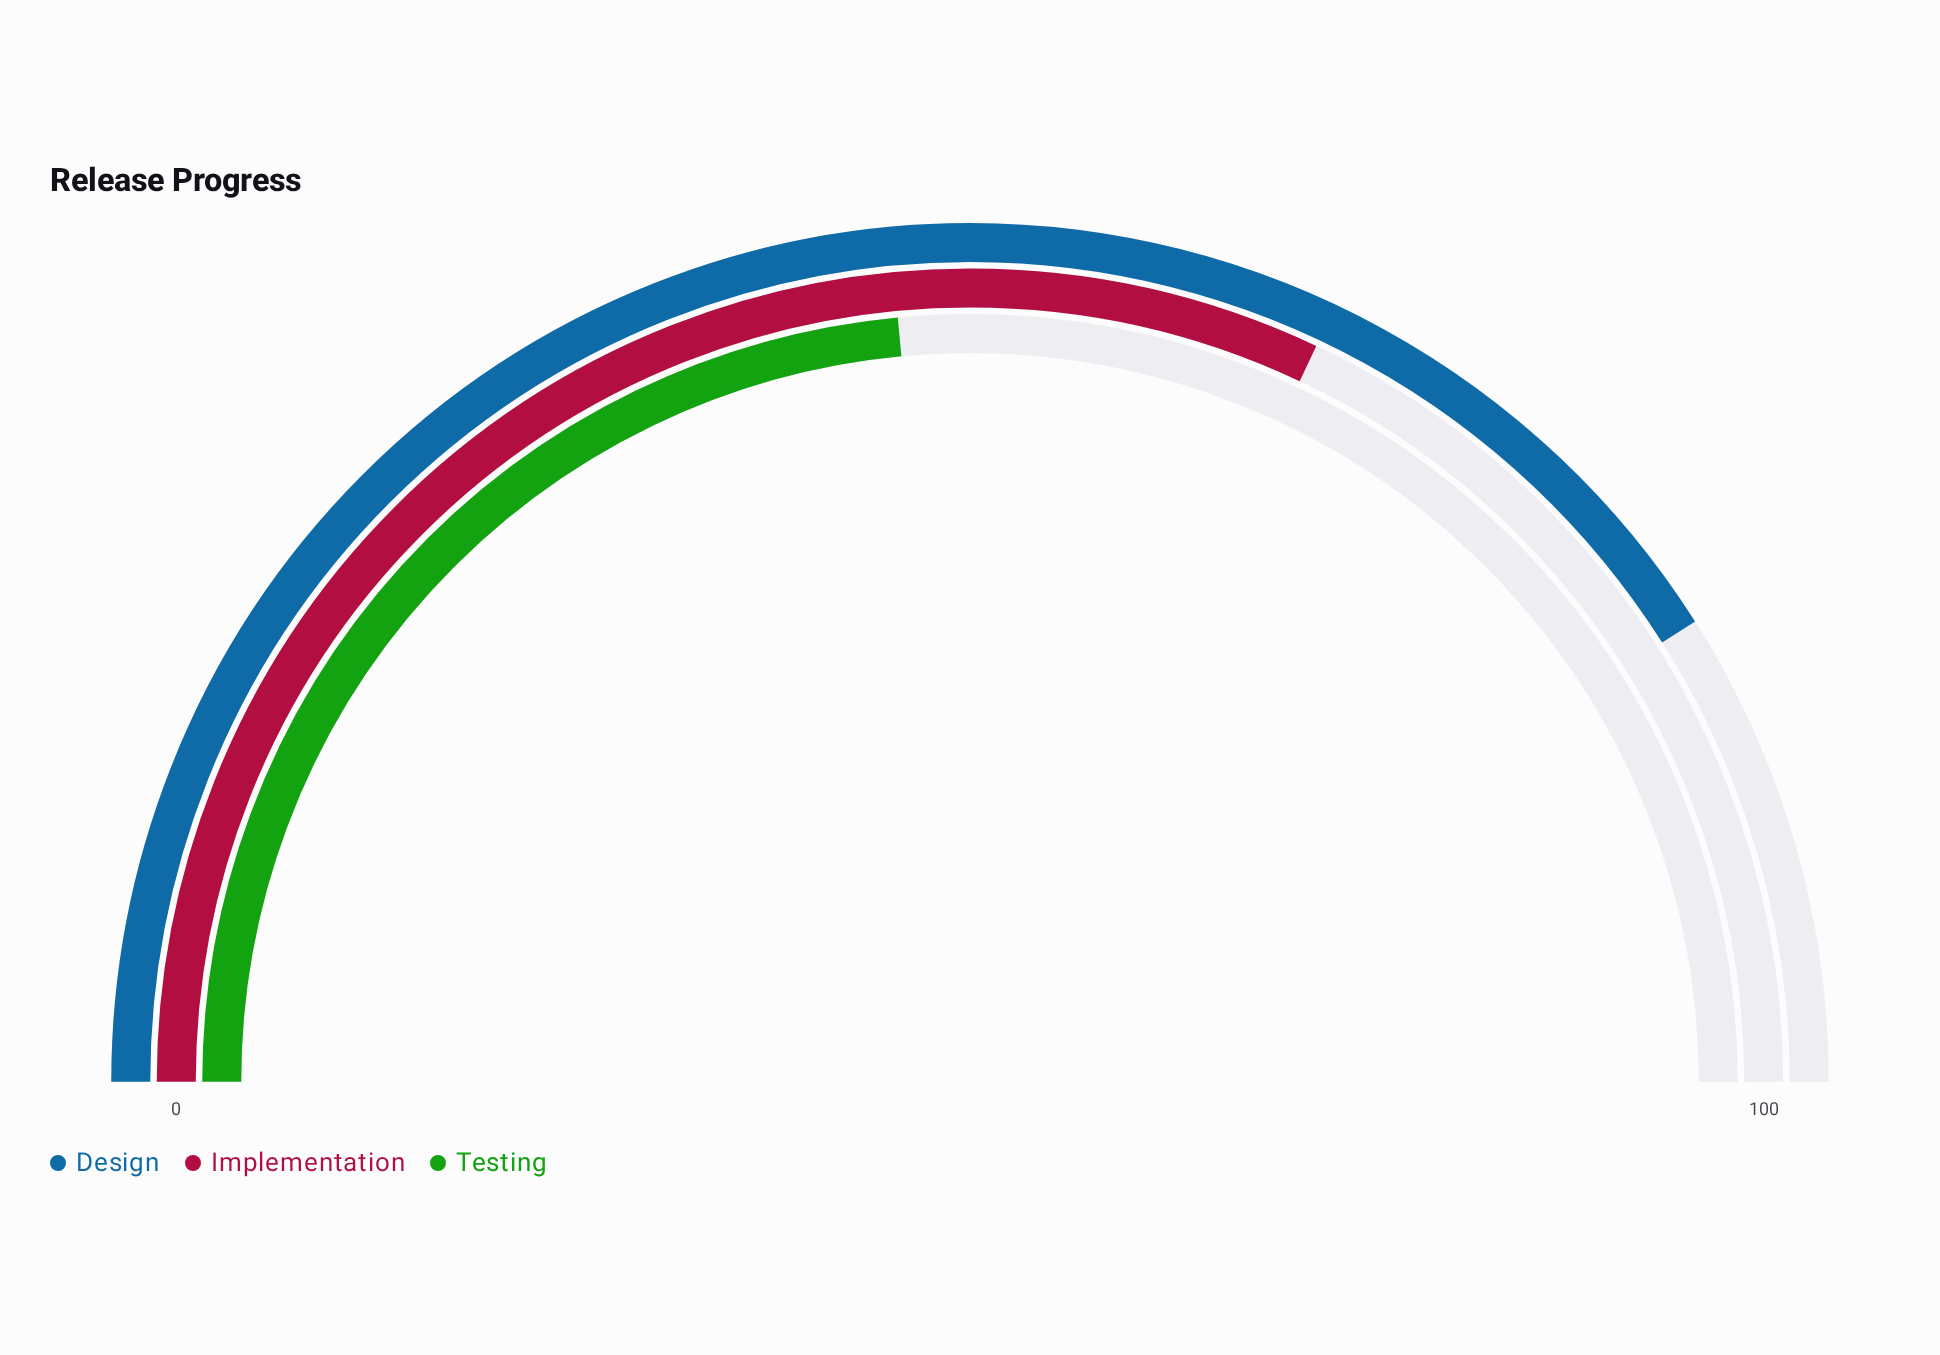
Each workstream has its own completion percentage and becomes a separate ring. All three values use
the default 0..100 range.
import androidx.compose.runtime.Composable
import io.github.hdcharts.core.model.toChartData
import io.github.hdcharts.gauge.RingGaugeChart

private data class TeamProgress(
    val metric: String,
    val percentComplete: Double,
)

@Composable
fun ShowTeamProgress() {
    val progress =
        listOf(
            TeamProgress("Design", 82.0),
            TeamProgress("Implementation", 64.0),
            TeamProgress("Testing", 47.0),
        )
    val data =
        progress.toChartData(
            value = { it.percentComplete },
            category = { it.metric },
        )

    RingGaugeChart(data = data, title = "Release Progress")
}
Capabilities
Range and Clamping
range.min marks the start of every arc and range.max marks its end. In this example, -25 stops at
the -20 start and 48 stops at the 40 end. Values below the minimum stop at the start; values above
the maximum stop at the end, while selection still reports the original
value. Range bounds must be finite. If max is not greater than min, the chart uses the default
0..100 range; a non-finite bound produces a validation error. This example uses a temperature scale
and formats both range endpoints and selected values in degrees Celsius.
@Composable
fun ShowTemperatureRange() {
    val data =
        listOf(-25.0, 12.0, 48.0).toChartData(
            categories = listOf("Below range", "In range", "Above range"),
        )

    RingGaugeChart(
        data = data,
        style =
            RingGaugeChartDefaults.style(
                range = RingGaugeChartDefaults.range(min = -20.0, max = 40.0),
            ),
        selectedValueFormatter = ChartValueFormatters.suffix("°C"),
        axisValueFormatter =
            ChartValueFormatter { value ->
                RingGaugeChartDefaults.axisValueFormatter.format(value) + "°C"
            },
    )
}
Ring Selection
Tapping a ring selects it, dims the others, and shows its category and original value in the title.
Tapping outside the rings clears the selection. selection exposes the selected value index to the
application, and interactionEnabled = false disables tap selection while allowing a programmatic
selection to remain visible. Ring Gauge does not use the timed auto-clear behavior of Segmented Ring
Gauge. This excerpt reuses data from Basic Usage.
@Composable
fun SelectProgressRing(data: ChartData) {
    val selection = rememberChartSelection()

    RingGaugeChart(data = data, selection = selection)
}
Ring Styling
Supply one color per value in ring order. width is the maximum ring width and can shrink when the
layout has less space; spacing sets the gap. A visible track marks the full configured arc behind
each independent value. This excerpt reuses data from Basic Usage.
@Composable
fun StyledTeamProgress(data: ChartData) {
    RingGaugeChart(
        data = data,
        style =
            RingGaugeChartDefaults.style(
                rings =
                    RingGaugeChartDefaults.rings(
                        colors = listOf(Color(0xFF2563EB), Color(0xFF0F766E), Color(0xFFDB2777)),
                        width = 18.dp,
                        spacing = 6.dp,
                    ),
                track = RingGaugeChartDefaults.track(color = Color(0xFFE5E7EB)),
            ),
    )
}
Labels and Formatting
selectedValueFormatter formats the selected ring's original value in the title, and
axisValueFormatter formats the range endpoint labels. The temperature example in Range and
Clamping shows both formatters and keeps whole-number endpoints free of a
trailing .0.